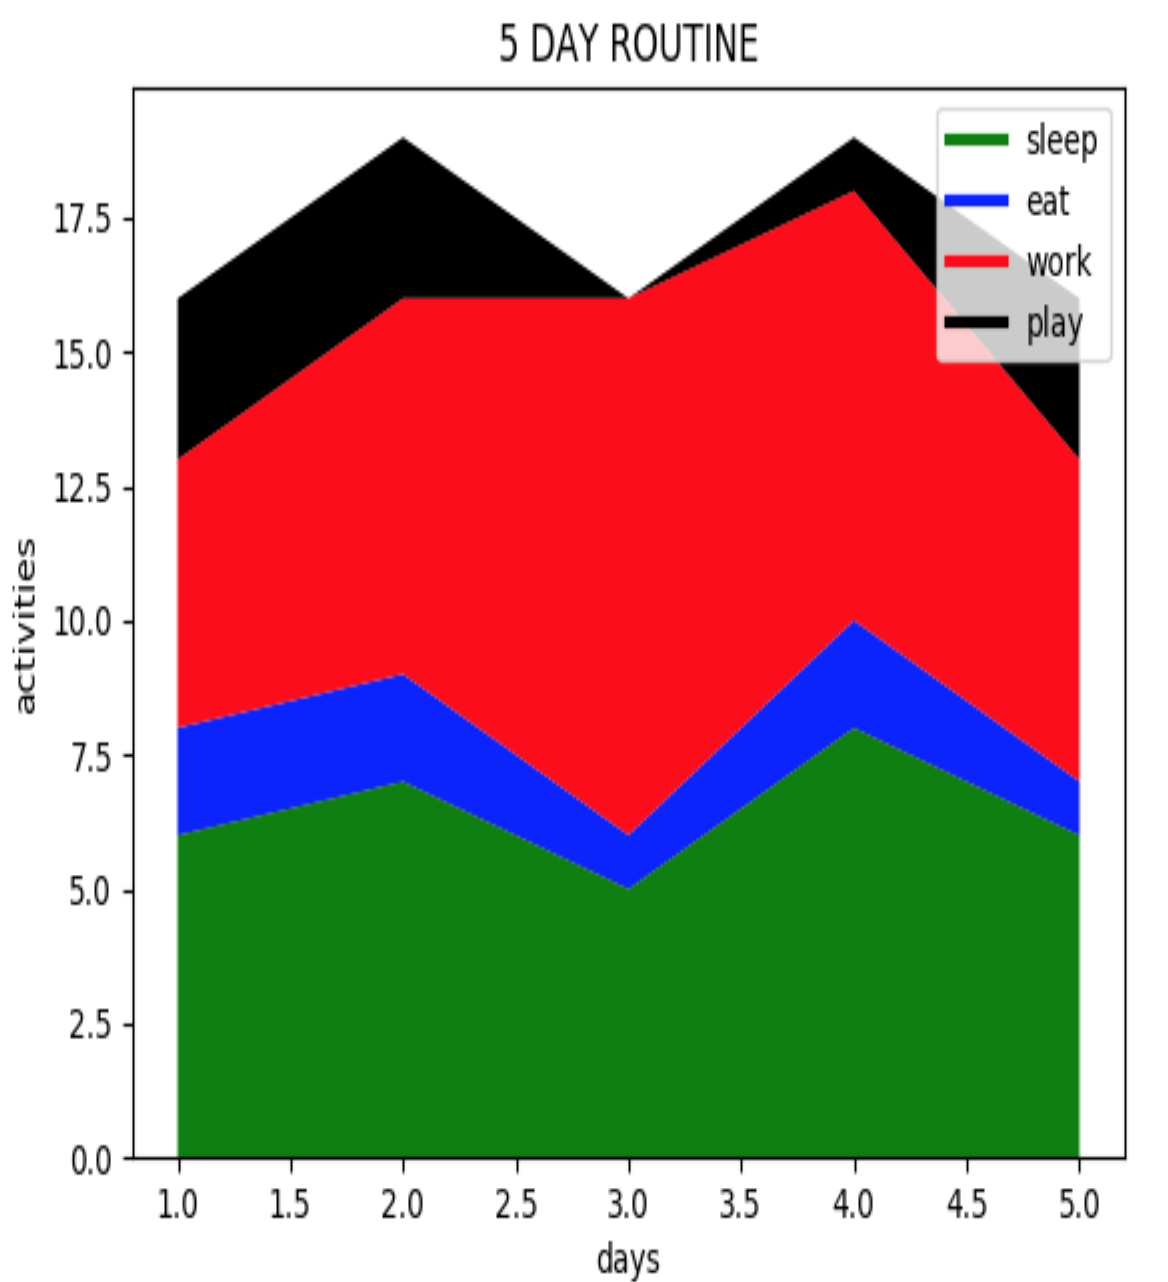
How to create a stack plot using matplotlib


The idea of stack plots is to show “parts to a whole” over time; basically, it’s like a pie-chart, only over time. Stack plots are mainly used to see various trends in variables over a specific period of time.

Matplotlib has a built-in function to create stack plots called stackplot().


Syntax

Take a look at the syntax below:

matplotlib.pyplot.stackplot(x, y1, y2, ..., yn, c=None, ...)

x and y1,y2,…,yn are the data points on the x and y-axis respectively. The function also has several other optional parameters such as color, area, alpha values, etc.

Example

See the example below which portrays the 5-day routine of a person on a stack plot. Routine activities include sleep, eat, work, and exercise. Click run to see the graph.

import matplotlib.pyplot as plt
days = [1,2,3,4,5]
sleep = [6,7,5,8,6]
eat = [2,2,1,2,1]
work = [5,7,10,8,6]
exercise= [3,3,0,1,3]
plt.plot([],[],color='green', label='sleep', linewidth=3)
plt.plot([],[],color='blue', label='eat', linewidth=3)
plt.plot([],[],color='red', label='work', linewidth=3)
plt.plot([],[],color='black', label='play', linewidth=3)
plt.stackplot(days, sleep, eat, work, exercise, colors=['green','blue','red','black'])
plt.xlabel('days')
plt.ylabel('activities')
plt.title('5 DAY ROUTINE')
plt.legend()
plt.show()
  • The first thing you do is import matplotlib (line 1)

  • Then, you create a variable, days, which will represent our x-axis data (line 3)

  • Next, you create the variables sleep, eat, work, and exercise with values that correspond to the days values (line 5 - 8)

  • You can use the plt.plot() function, where you specify the color and the label for each constituent, to add legend data (line 11 - 14)

  • Then, you have the line plt.stackplot(days, sleep, eat, work, exercise, colors=['green','blue','red','black']) with the days variable as the x-axis. Next, the sleep, eat, work, and exercise variables are plotted as y-axis data in the order specified. The colors are matched in a corresponding order for the y-values. (line 16)

  • Then, you can add the legend, title, x-label, and y-label. (line 18 - 21)

  • Finally, we show the plot (line 22)

Copyright ©2024 Educative, Inc. All rights reserved