Demystifying sklearn.cluster.kmeans
Getting started
sklearn.cluster.kmeans is a really cool algorithm that helps you to group data points according to how similar or close to each other they are. But how does it work?
Sklearn? cluster? K-means?
Scikit-learn (sklearn) is an open-source Python library that is mainly used in data analysis and machine learning. In machine learning, there are (arguably) two main categories:
- Supervised machine learning, which has both the
predictor variables also called features or independent variables target also called the label or dependent variable - Unsupervised machine learning which has only has independent variables, and is used for pattern recognition.
The below example highlights the difference:
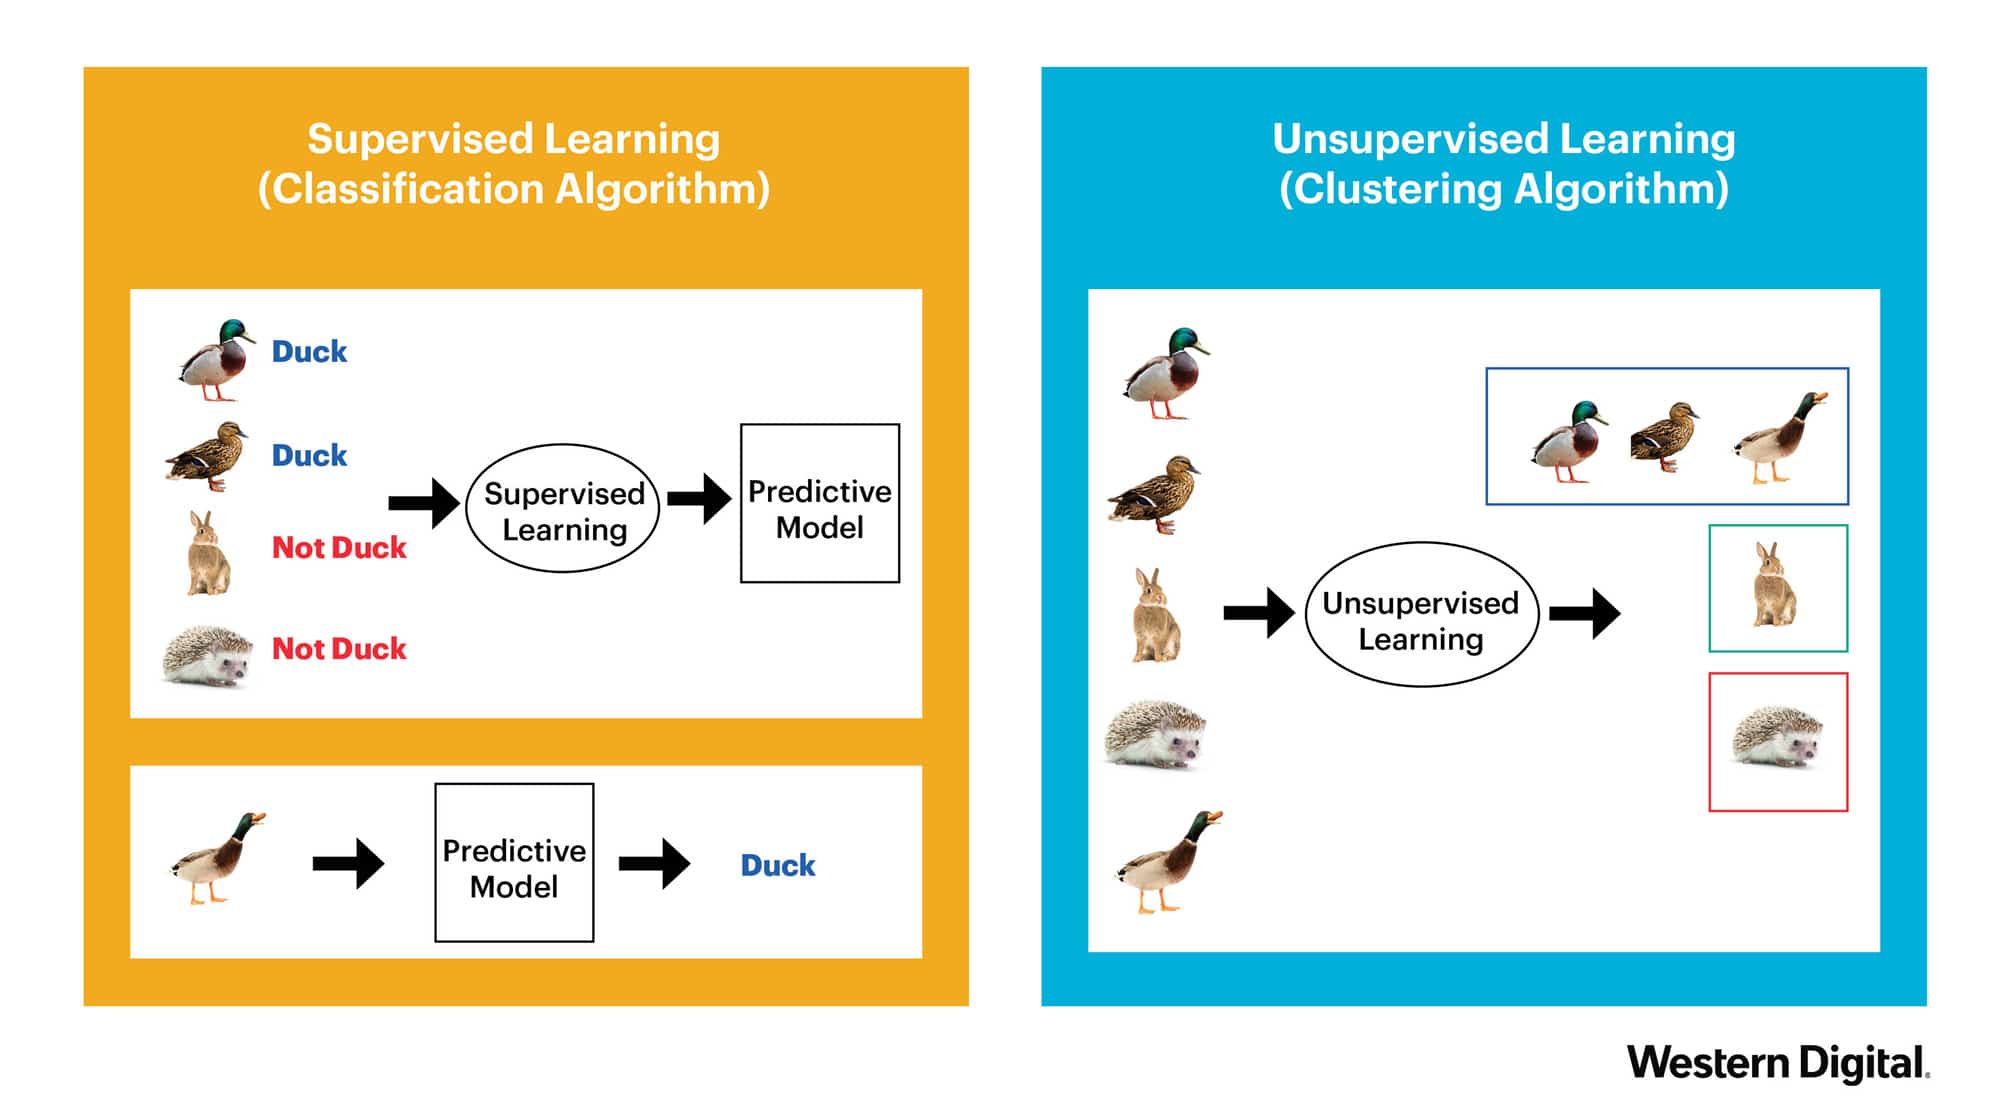
As seen in the above image, the supervised learning method uses the classification algorithm to predict whether an animal is a duck or not. The data has labels/targets (“Duck” vs “Not Duck”) which the algorithm uses to make predictions. On the other hand, the unsupervised learning algorithm uses clustering to group the animals into categories or clusters based on their similarities. The three birds are in one cluster, the rabbit is in another, and the hedgehog is in yet another cluster.
K-means clustering is a clustering algorithm that divides data points into groups or clusters based on how similar or close to each other they are. Each cluster has a centroid, which is a real or imaginary data point that is at the center of the cluster. The aim of k-means clustering is to minimize the distance between the cluster points and their respective centroids.
sklearn.cluster.kmeans uses the K-means algorithm which is part of the cluster module in the Sklearn library.
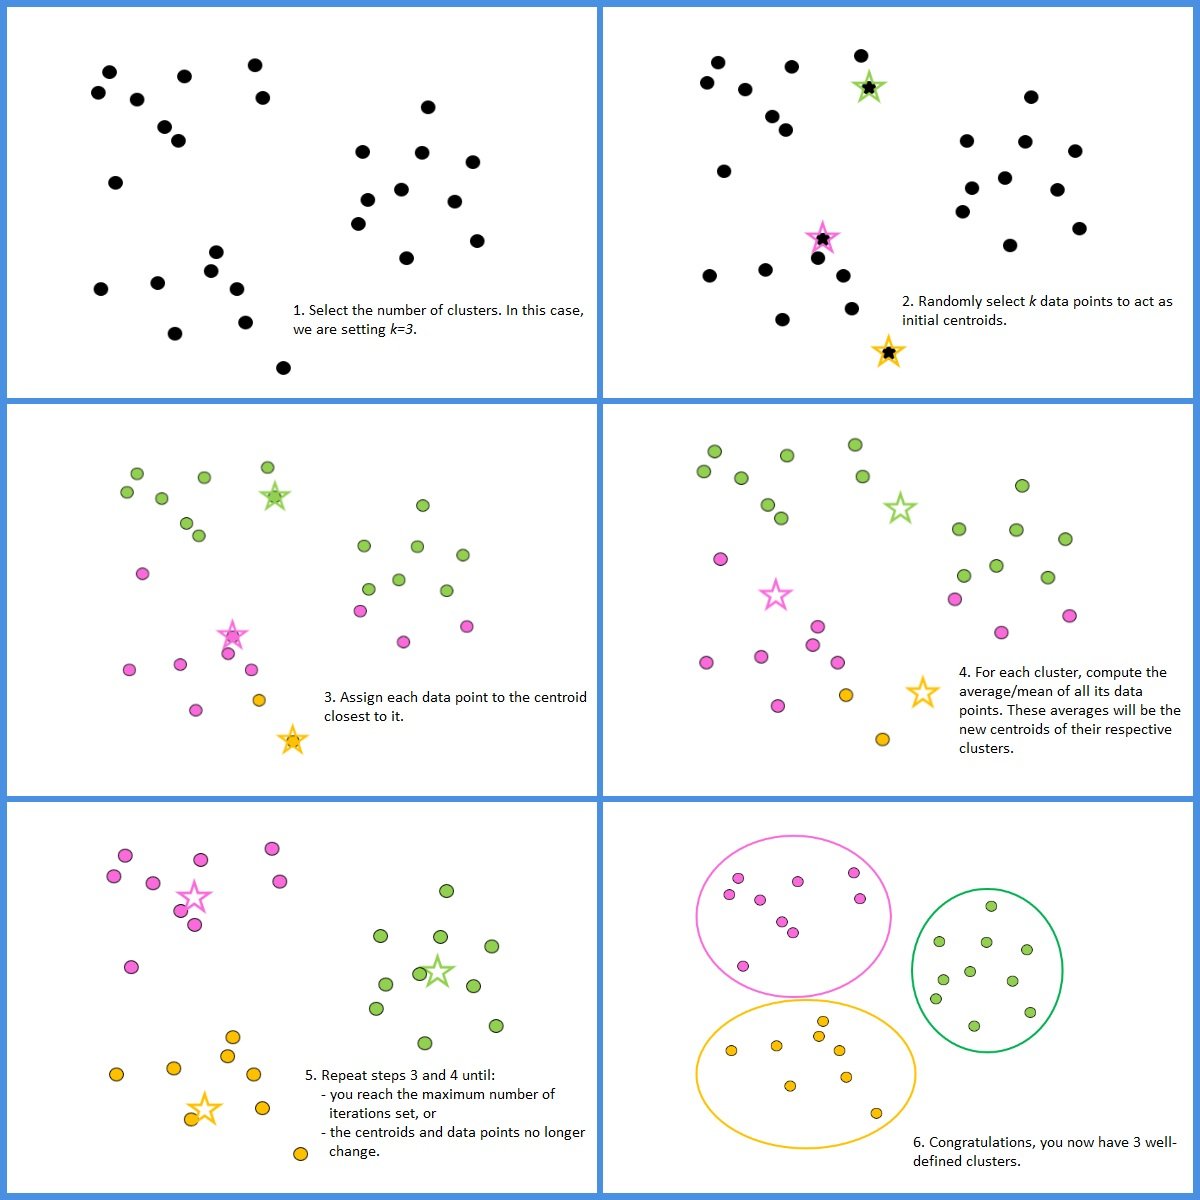
How does K-means clustering work?
- Choose a value for the number of clusters you wish to have. For example, k=3 will set up 3 clusters.
- Randomly select k data points to act as initial centroids for those clusters.
- Measure the distance between each point and the centroid, and assign each point to the cluster it is closest to.
- Calculate the means of the data points in each cluster and set them as the new centroids or cluster centers.
- Repeat the process of adding data points to clusters whose centroids they are closest to until the centroids and other data points stop changing or until you reach the maximum number of iterations.
Code implementation
We will now implement K-means clustering with Python3.
First, we load the necessary libraries we will work with:
# import the necessary librariesimport numpy as npfrom sklearn.cluster import KMeansfrom sklearn.datasets import make_blobsimport matplotlib.pyplot as plt
Next, we generate sample data that we will use to demonstrate K-means clustering.
# generate sample data to use and visualize it using a scatter plotdata, labels = make_blobs(n_samples = 900, n_features = 2, random_state = 0)plt.scatter(data[:, 0], data[:, 1])plt.show()
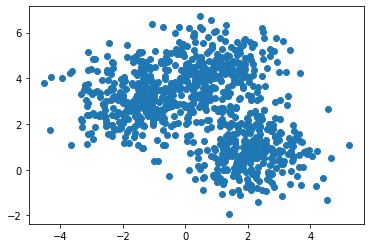
This is the result. Pretty unappealing, I know. With our bare eyes, we can see that there are two distinct clusters, and the larger cluster above the smaller one looks like it can be split in the middle. Let’s use K-means clustering to create our clusters. We will use k=3.
# set up the initial algorithm with 3 clusterskmeans = KMeans(n_clusters = 3, random_state = 0)# fit the algorithm to the datakmeans.fit(data)# get the labels of each data pointclusters = kmeans.labels_# store the unique names of each clusterunique_clusters = np.unique(clusters)
Finally, we plot the data points as before, but, this time we color the points so that each cluster has a distinct color.
# plot every data point on a scatterplot and color it according to its clusterfor cluster in unique_clusters:row = np.where(labels == cluster)plt.scatter(data[row, 0], data[row, 1], label = cluster)plt.show()
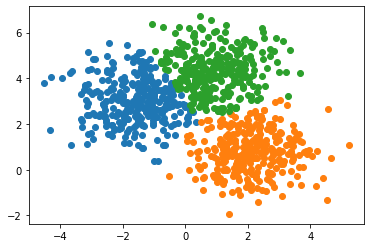
Voila! We have successfully implemented K-means clustering.
