How do you monitor the memory consumption of Python functions?
Why monitoring memory consumption is important
When we are developing an application that is going to be used by many users, we need some memory to execute that application at scale. When developing such an application, we usually don’t really care if the variables (i.e.,the memory occupied by them) are released to the operating system and unknowingly assigned new memory blocks. However, this can cause our application to crash due to the memory limit.
Hence, we should profile the memory consumption by using Python code to ensure that we are not creating unnecessary blocks of memory.
How to monitor memory consumption
We will be using the memory_profiler package; an open-source Python package that performs line-by-line memory profiling for your Python code.
Let’s first install the package by running the command below:
pip install memory_profiler
When you want to execute the Python file and perform memory profiling, you should use:
python -m memory_profiler <filename>.py
Now, let’s take a look at the code:
from memory_profiler import profile@profiledef my_func():a = [1] * (10 ** 6)b = [2] * (2 * 10 ** 7)c = [3] * (2 * 10 ** 8)del breturn aif __name__=='__main__':my_func()
Explanation:
- In line 1, we import the required package.
- In line 3, we add a decorator
@profileto track the function line by line. You need to add this decorator before every function that you want to track for memory consumption. - In line 4, we define our function.
- From lines 5-9, we define the logic of the function. This is just normal logic; you can add the logic as per your needs.
- In line 12, we call our function.
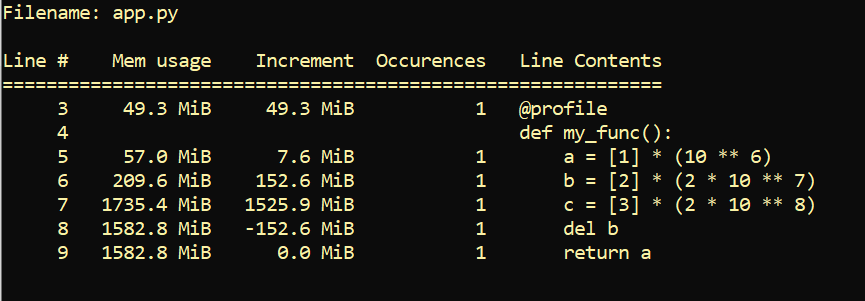
When we run the above code with the statement:
python -m memory_profiler main.py
You can expect a similar output to the one shown below:
So, in this way, we can track that our Python code efficiently uses the memory.
