What are the 11 Firefox DevTools tips and tricks?
Below are the 11 Useful Firefox DevTools functionalities you might have missed.
1. Simulate fast or laggy network
Testing our web pages in the local host of our machine is very fast indeed, but our webpages are guaranteed to encounter laggy networks in the wild. How would they behave in that scenario?
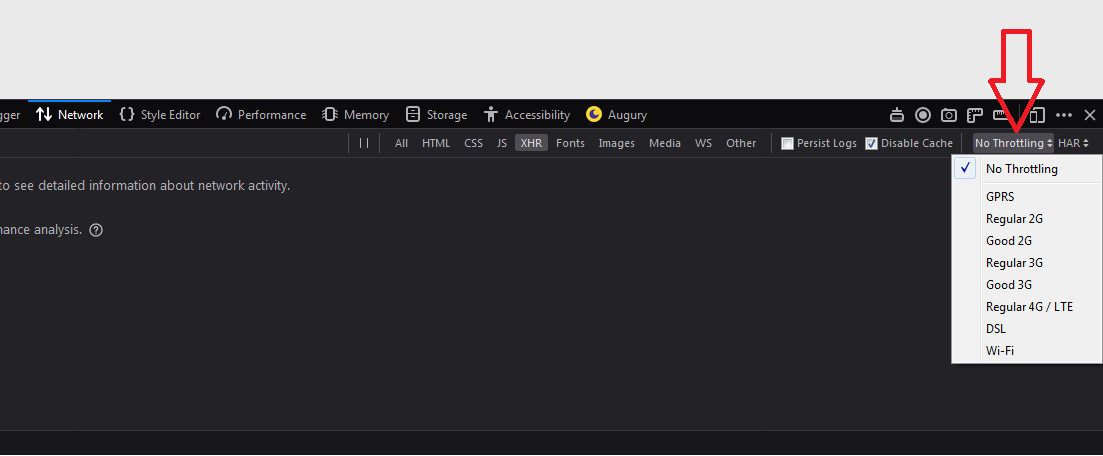
We have an option in our browser to choose how fast a page can load. Go to the Network tab and, on the right-hand side, click on the No Throttling dropdown button. You will see different network options: GPRS, Regular 2G, Good 2G, Regular 3G, Good 3G, Regular 4G, Wi-fi.
2. Taking a screenshot of a page
You don’t need extra software to take screenshots of your page, as you can do it from your browser’s DevTools.
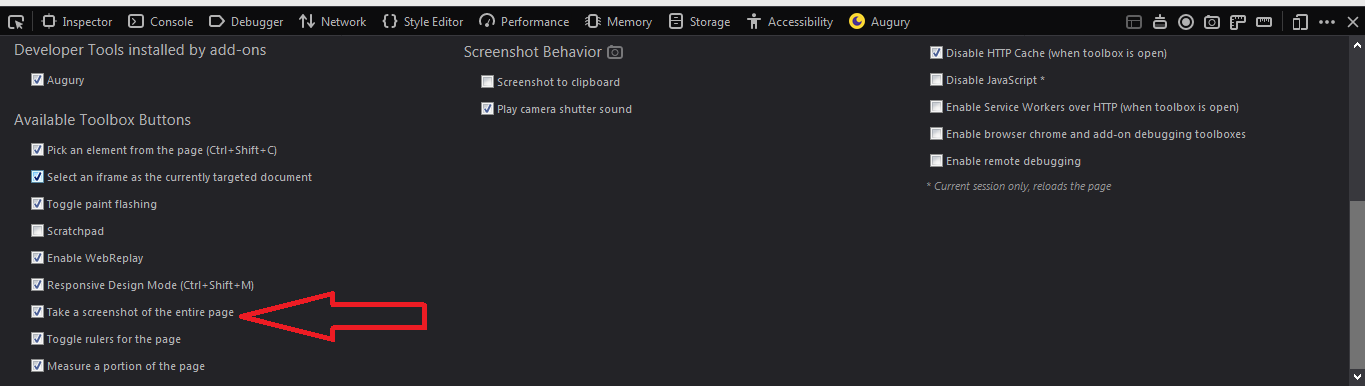
Go to your DevTools settings and enable the Take a screenshot of the entire page checkbox.
This will cause a button to be added to the DevTools:
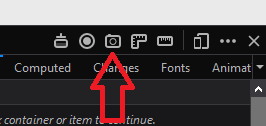
Click on the camera icon to take a snapshot of the current page.
3. Toggle paint flashing
We can make the browser show us spots and sections on a page that have been updated by highlighting those sections with colors. This is called paint flashing.
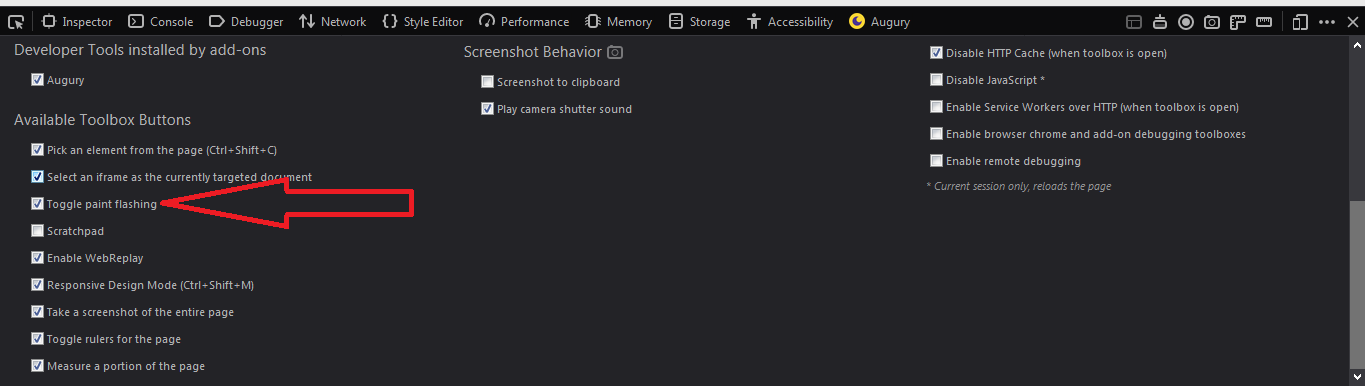
To enable paint flashing, go to settings and check the Toggle paint flashing box. This will add the following icon to your DevTools:
Clicking on the icon will activate paint flashing. Now, elements or groups of elements that are re-painted/updated by the browser will be highlighted with different colors.
For example:
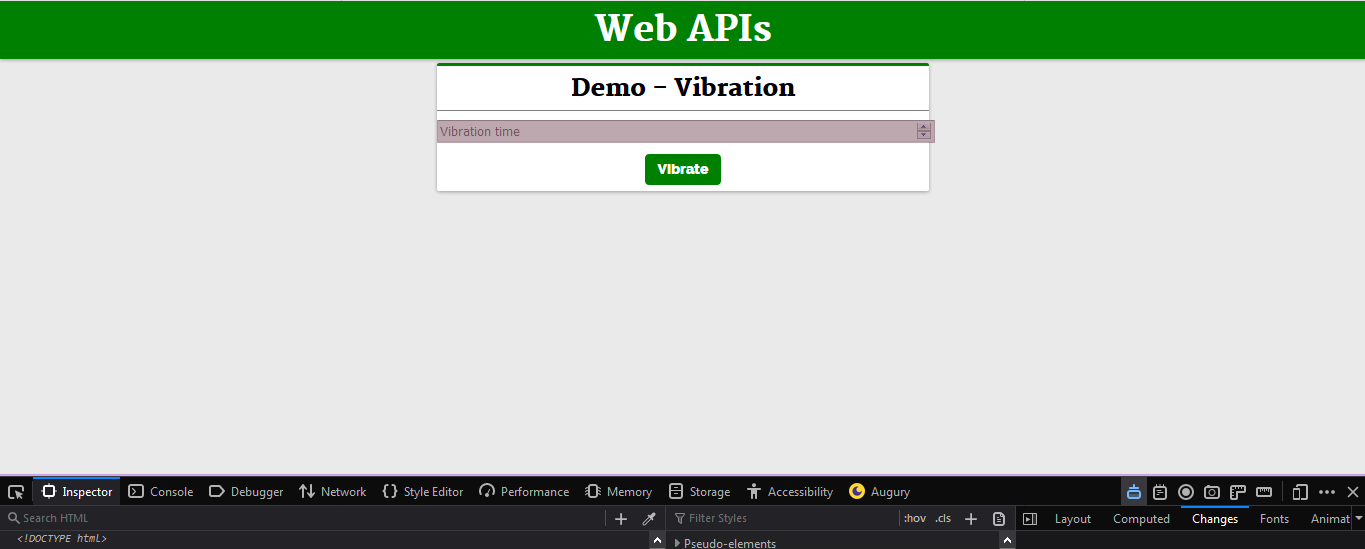
Paint flashing is enabled, and no area is painted because it just rendered.
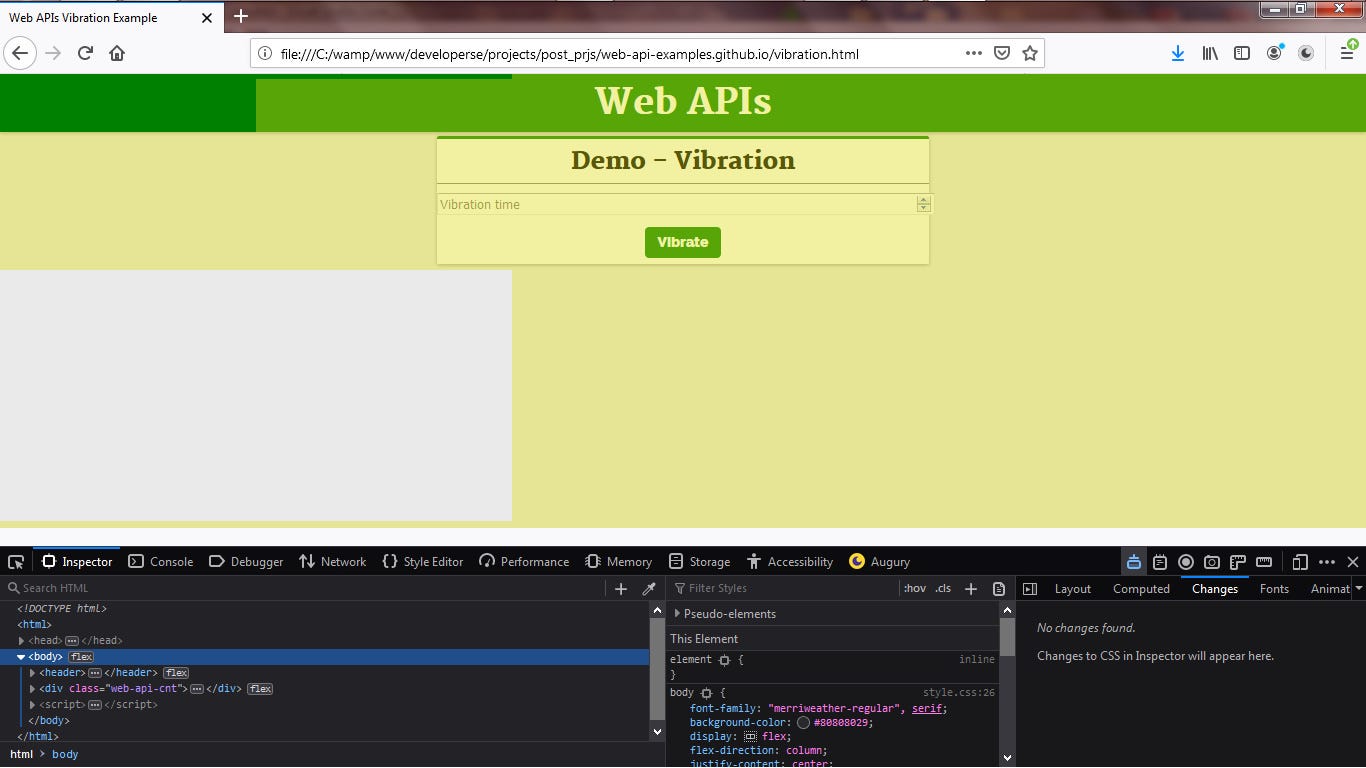
Click on the Restore button in the browser window to resize the browser window.

The colored areas are the areas that were re-rendered by the browser to make the elements fit the adjusted size of the browser. Notice that the top-leaf area of the green “Web APIs” was not colored because it needs no update to fit the current size.
If you adjust the browser window to its normal size, you will see a re-paint, as shown below:
The painted areas are the areas that are re-rendered/re-painted by the browser to adjust to the size of the browser.
4. Debugger
This tool is useful in debugging scripts. You can add breakpoints in your script, which will cause your script execution to stop at those breakpoints.
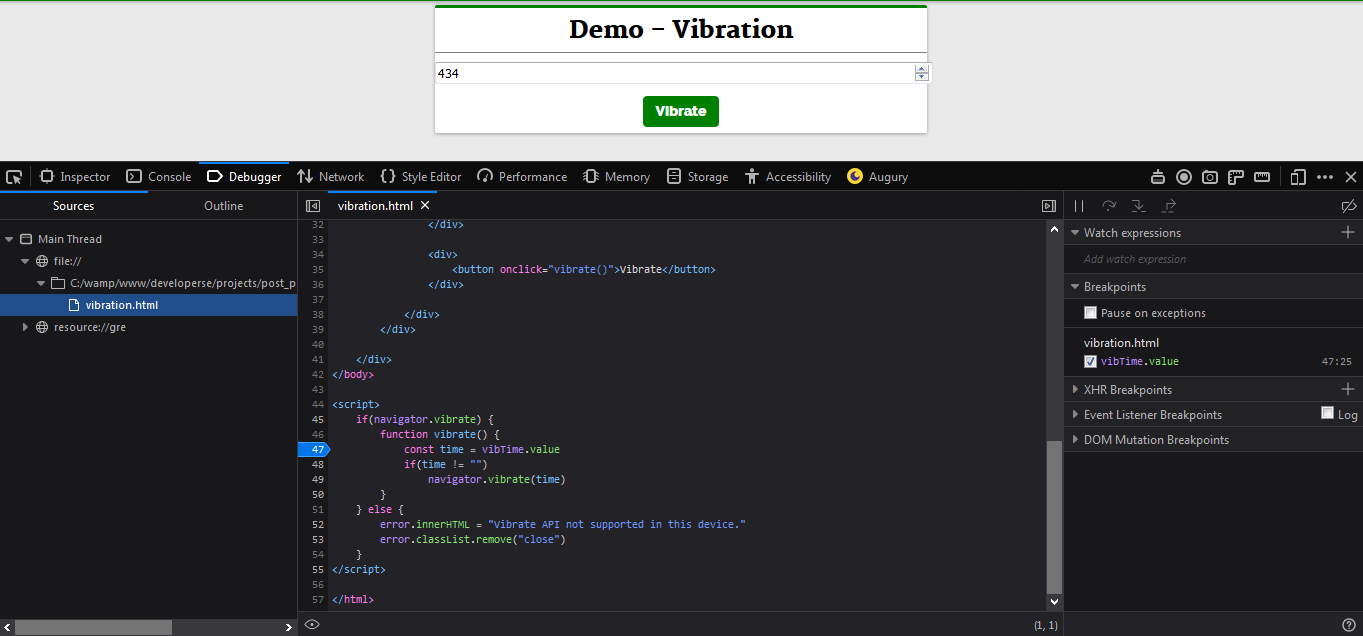
We add a breakpoint at line 47. When we click the Vibrate button, the vibrate function will run and pause at line 47 where the statement reads .
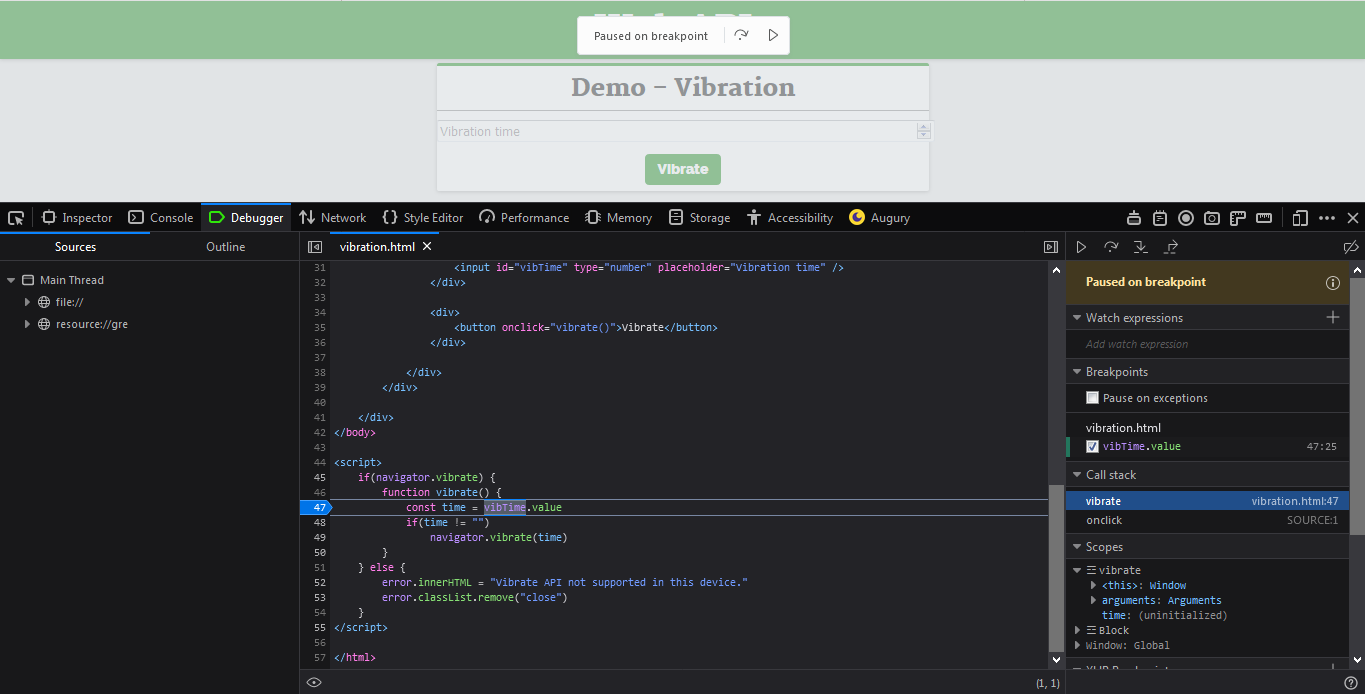
We click the Vibrate button and the script is executed and stops at line 47. If you look to the right, you will see the Breakpoints tab, which lists all the breakpoints in the current script.
The call stack shows the series of function calls that were made before arriving at the current breakpoint. For example, onclick was called before the vibrate function.
The scopes show the variables attached to the window scope and the block scope, i.e., the scope of the current breakpoint.
At the top of the scopes are buttons: Pause, Step over, Step in, Step out, and Resume.

The Pause button pauses the execution of the script.
Step over executes a line in the script and jumps over to the next line without stepping inside the statement.
For example, if we have:
1
    2
   >3 const a= 67
    4 foo()
    5 b = 9900
    6
    7 function foo() {
    8 }
We have a pause script at line 3. If we click the Step over button, the execution will move to line 4, which is a function call. Pressing the step over button here will cause the foo call to execute without moving to the foo declaration at line 7. The program will execute the foo call and move to the next line.
Step in causes the execution to move into the body of a function call or object. In our above example, pressing the Step in button on line 4: foo() will cause the execution to move into the foo function body in line 7. It will step inside the function body.
Step out executes the whole current block and then moves out of the block. Using our above example, if we had stepped into the foo function body, pressing Step out would execute the whole body and return to line 5.
Event listener breakpoints
These breakpoints let us add event breakpoints to our script.
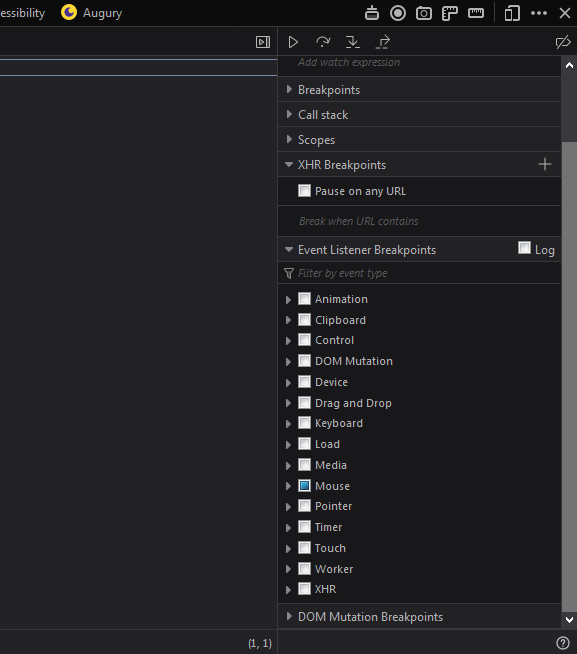
The above lists event breakpoints we can add to our script. We see Clipboard, Mouse, Keyboard, etc. If we click on the Mouse:

We see the Mouse-based events listed: click, dblclick, mouseout-over-enter-leave, etc.
Now, let’s check the click box. This will make our script stop at any click event registered on our page. We register click on the Vibrate button. If we click on the Vibrate button, our script will pause at the vibrate function:

DOM mutation breakpoints
This enables us to add breakpoints to our elements to break our script when a DOM element is mutated.
What is DOM mutation? DOM mutation occurs when the DOM node is removed or when its attribute is changed, or when the Node subtree is changed.
Go to the Inspector and right-click on an element, then click on “Break on…”, and on the right, you will see “Subtree modification”, “Attribute modification”, and “Node removal”.
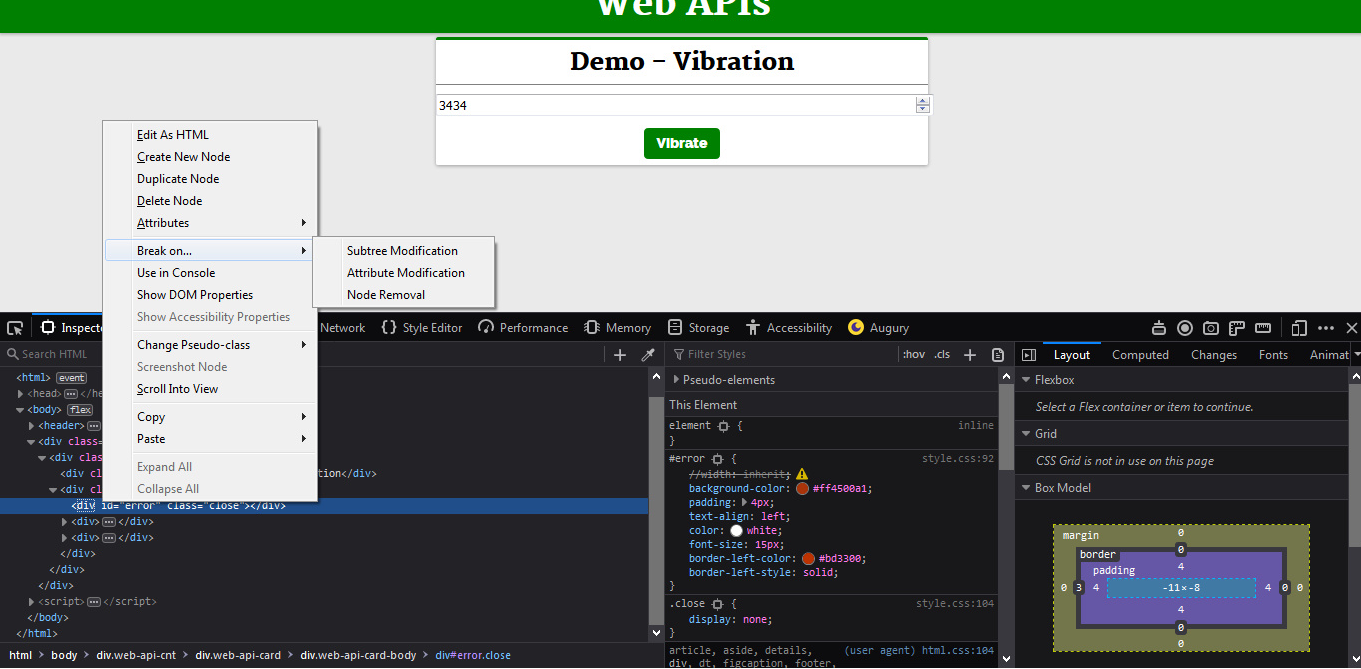
“Subtree modification”: This will add a breakpoint to break when the children elements of the selected element are modified/changed in any way.
“Attribute modification”: This causes the page to break when an attribute of the selected element is modified in any way.
“Node removal”: This will cause the page to break when the DOM node is removed.
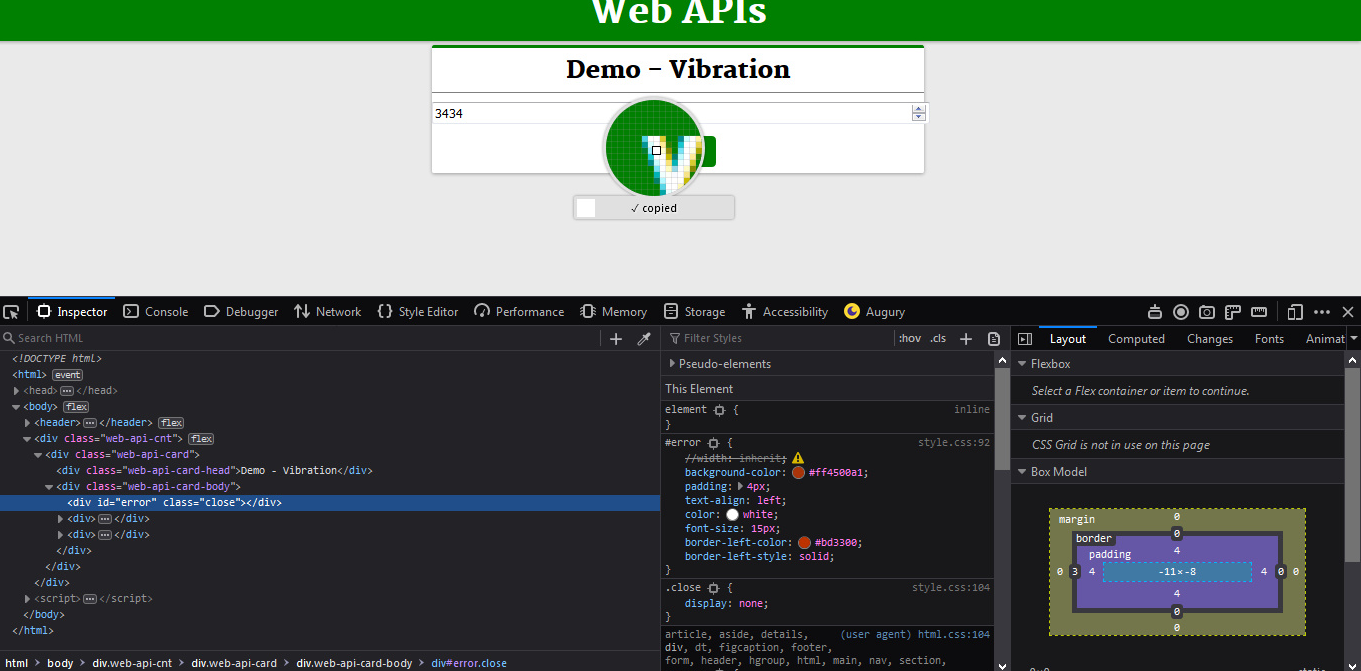
5. Grab a color from a page
You can grab a color from a page. Go to the Inspector tools and click on the dropper icon.
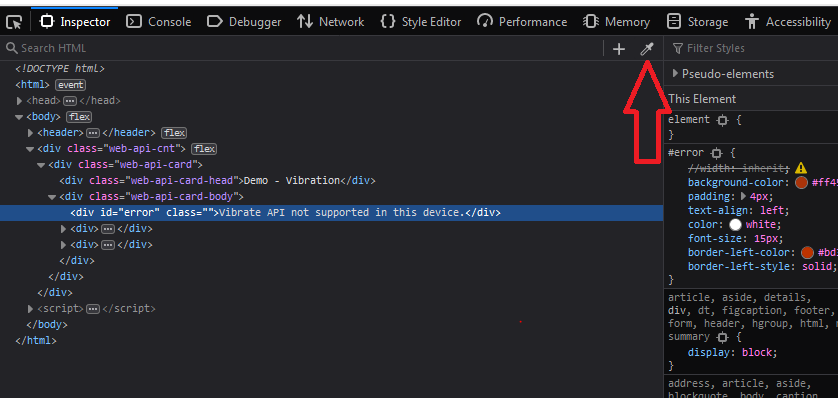
This will cause a hover panel to appear on the page with an indicator panel that shows the hex value of the color code of the element below the panel.

Clicking on the element will cause the color code to be copied to the Clipboard.
6. Responsive Design Mode
We don’t build websites only for desktop viewing. In fact, a high number of web users are operating mobile devices. With that in mind, we must make our web pages adapt to the screen mode of mobile devices.
A webpage built solely for desktop viewing will have a serious layout problem when viewed on mobile phones.
So, we need to test for different view screens when building apps. Responsive Design Mode provides different mobile view screens so we can see how a webpage will layout the DOM when viewed on a mobile phone. It is just like a phone simulator.
To enable Responsive Design Mode, click on the icon in the DevTools.

This will present our webpage on a mobile phone view:

We can change the device view to any phone model, iPhone, Galaxy, iPad, etc. We can even rotate the viewport, just like we do on our phone to toggle between landscape and portrait mode.

7. Changing an element’s Box properties from the Inspector tool
Switching between your IDE and browser to change or add styling properties to your elements and see the effect in the browser can be very tiring. The Inspector tool contains the Box Model in the right tab to help with quick styling changes to selected elements.
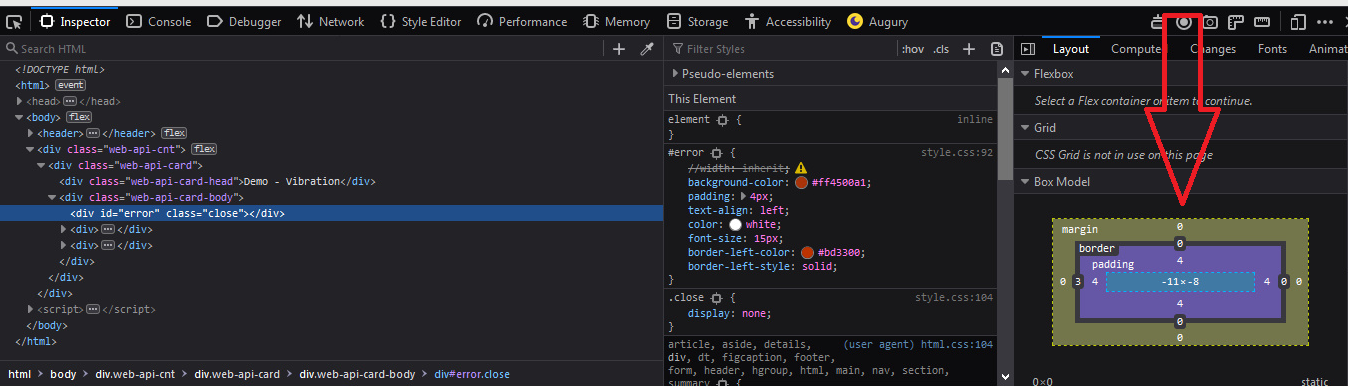
Here, you can change the width, height, padding, margin, and border of any element.
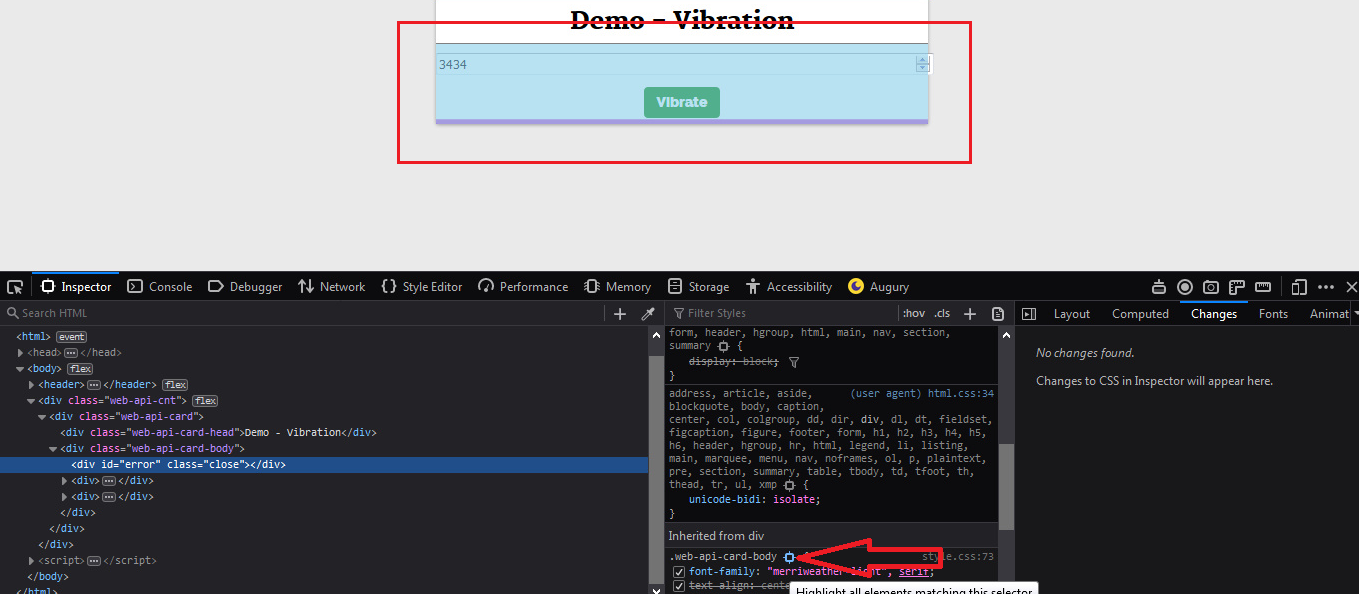
8. Highlight elements using a selector
Did you know that you can highlight elements in the DOM using a CSS selector?
Go to the Inspector tool, and in the middle tab where element styling properties and values are displayed, you will see a target icon.
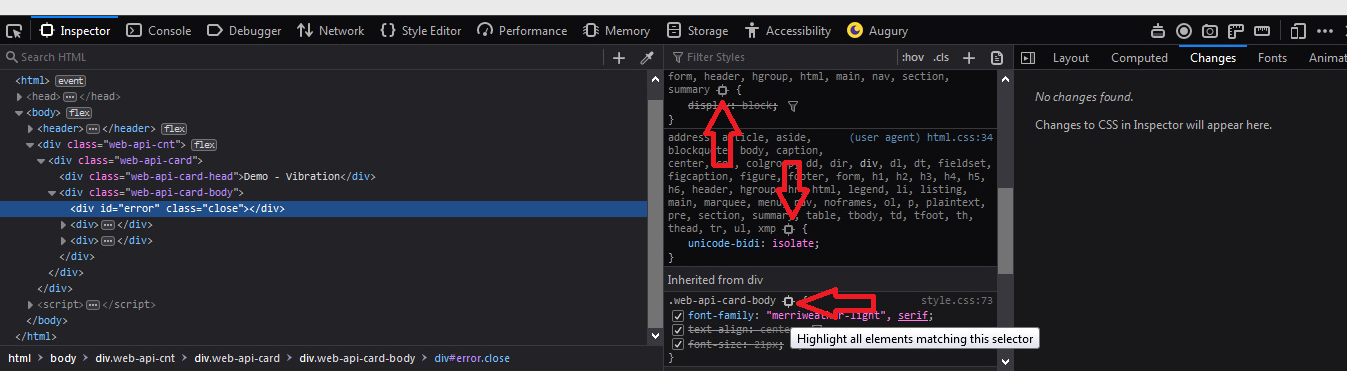
Clicking on the icon will make the DevTool highlight all elements with the CSS selector in the DOM.
9. Tips about the Inspector tool
The Inspector tool can be very useful. See here:
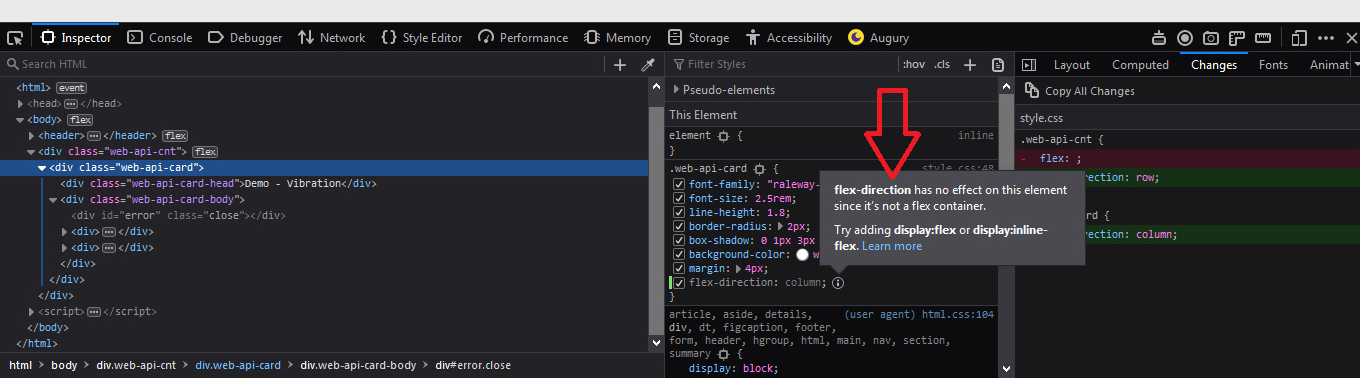
Here, we add property flex-direction: row to a non-flex element. The Inspector cancels it out and gives us useful information to try adding “display: flex;” or “display: inline-flex;” to the web-API-card element.
10. Measure the portion of a page
There is a tool that we can use to measure any portion of a page.
To activate this, go to settings and check “Measure a portion of the page.”
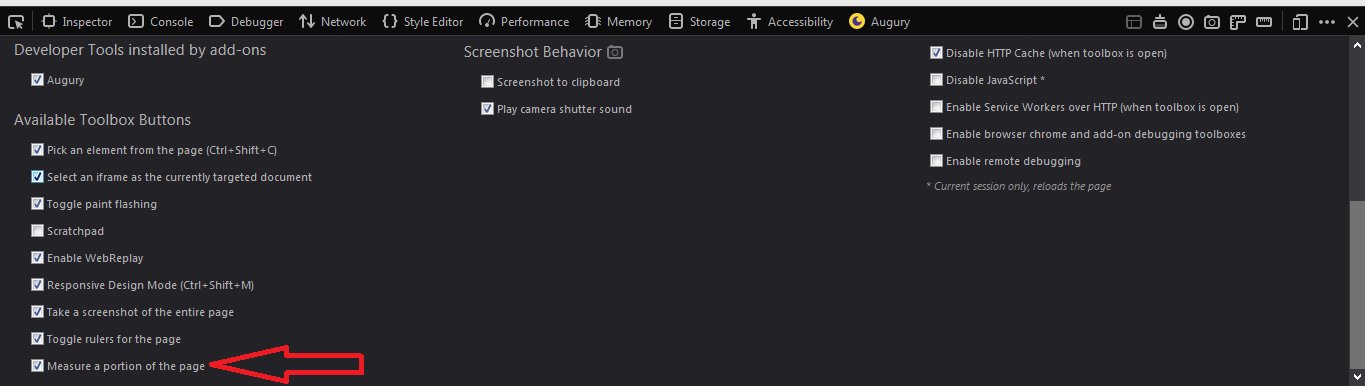
This will place the following in the DevTools.
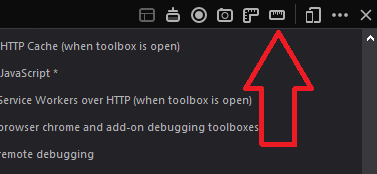
Clicking on the icon will bring up a hovering target panel on the DOM with a display of the top and left position of the current element underneath it.
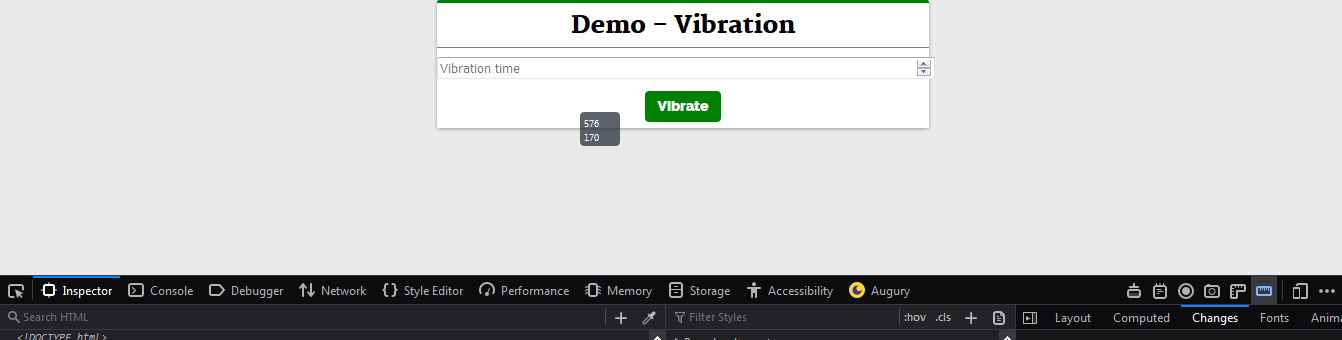
Moving the mouse over the page will make it display the current top and left position values of the mouse position.
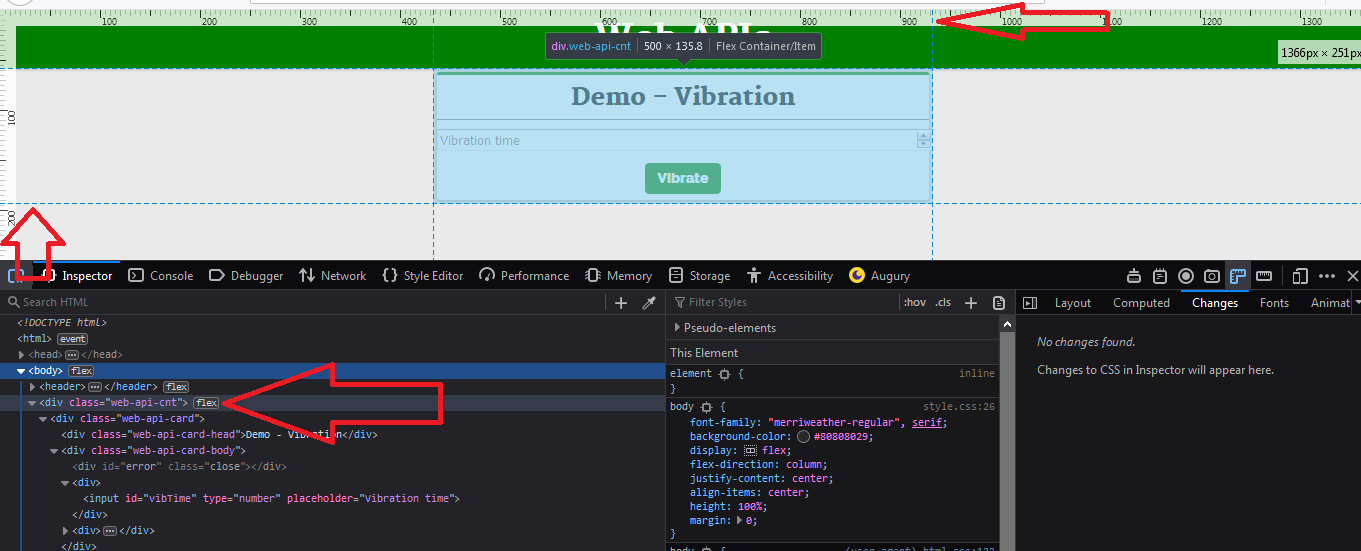
11. Toggling rulers for a page
We always work with the page’s width and height measurement to know how and where to place our elements. Most times we gauge with our eyes to see where an element can extend to.
There is a tool in the DevTools that can help us indicate the measurements of the entire DOM area. To activate this tool, go to the settings and check the “Toggle rulers for the page” box to add a rule icon in the DevTool box.
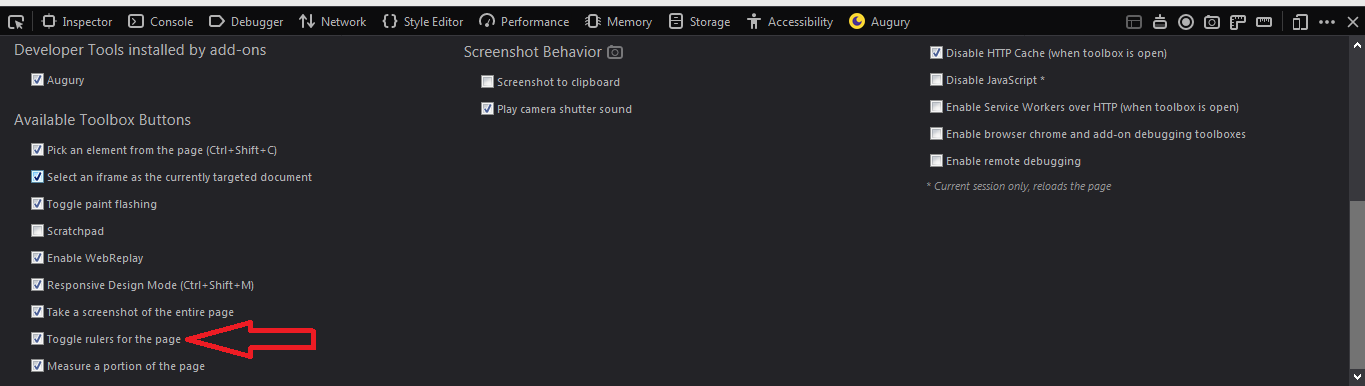
Clicking on this icon will add a ruler overlay on the height and breadth of the DOM.

We can then use the Inspector selector tool to augment our height and width calculation accuracy:
Free Resources
- undefined by undefined
