Yes. In 2026, System Design is a core skill for software engineers, especially for mid-level and senior roles. Companies increasingly expect candidates to understand scalability, reliability, and real-world architecture decisions. Learning System Design not only helps you pass interviews but also prepares you for building production-grade systems.
AI-powered learning
Save this course
Grokking Modern System Design Interview
Everything you need for Grokking the System Design Interview, developed by FAANG engineers. Master distributed system fundamentals and practice real-world interview questions.
4.6
204 Lessons
8 Mock Interviews
26h
Updated this week
Join 3 million developers at
Join 3 million developers at
LEARNING OBJECTIVES
- A 45-minute answer structure with RESHADED for any System Design Interview
- An understanding of how to frame open-ended interview problems as specific requirements, constraints, and success criteria
- The ability to design scalable, reliable systems with databases, caches, load balancers, queues, and microservices
- Pattern toolkit: sharding, replication, consistency models, CQRS, and event-driven design
- Capacity and reliability skills: throughput and latency math, bottlenecks, SLIs and SLOs, failure handling
- Communication under pressure: fast diagramming, clear trade-off narratives, effective checkpoints
- Mock Interview practice with timed scenarios, model answers, and rubrics to build confidence and spee
KEY OUTCOMES
Ace System Design Interviews
Navigate complex system design interviews with confidence, using structured frameworks to communicate your design choices effectively.
Architect Scalable Distributed Systems
Design and implement scalable distributed systems that meet real-world demands, ensuring reliability and performance under load.
Evaluate System Design Trade-offs
Assess and justify design trade-offs in interviews, demonstrating a deep understanding of scalability, reliability, and fault tolerance.
Lead Technical Design Discussions
Facilitate technical discussions around system architecture, clearly articulating design decisions and their implications for stakeholders.
Why choose this course?
System Design skills are non-negotiable
If there’s one skill that every developer needs to know to be successful in the AI era, it’s System Design. That’s why System Design Interviews still determine your starting role and salary at top companies.
From building blocks to System Design Interview master
Master the fundamentals of modern System Design from the ground up. Use the RESHADED method to unlock any System Design problem you encounter.
13+ real-world case studies; one battle-tested formula
Understand the architecture that powers hyperscalers like YouTube, WhatsApp, and Uber. Then apply RESHADED to unlock dozens of real-world System Design Interview questions.
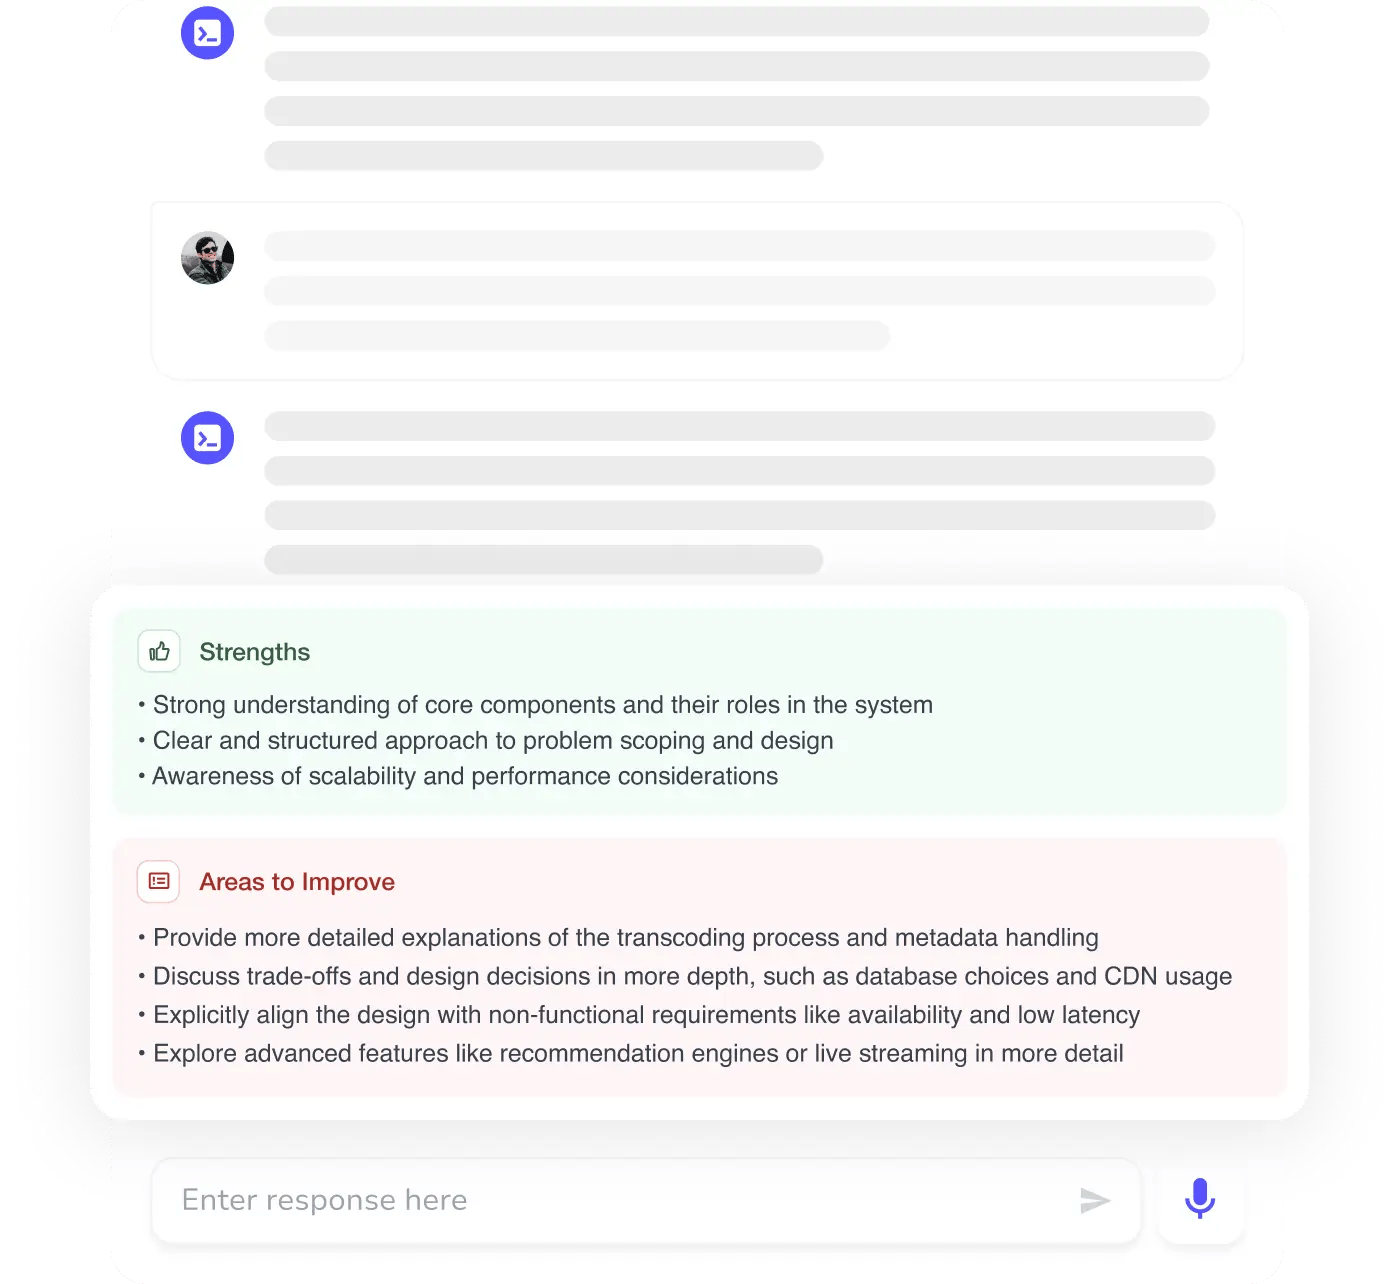
Benchmark your skills with AI Mock Interviews
Put your new skills to the test as you go. Take on real-world design challenges and embedded AI mock interviews that simulate the hiring process at top companies.
Curriculum developed by MAANG engineers
The #1 System Design course created by industry pros who built global-scale distributed systems at Meta, Google, and Microsoft. Used by millions of learners to land SWE, TPM, and EM roles.
Learning Roadmap
1.
Introduction
Introduction
Get familiar with System Design and the course structure, including prerequisites that set the foundation for mastering System Design Interviews.
2.
System Design Interviews
System Design Interviews
Explore what System Design Interviews involve, including essential preparation strategies, fundamental concepts, key resources, and tips to perform well.
Getting Ready for the System Design InterviewThe Do’s and Don’ts of the System Design InterviewSystem Design Interview Trap: Why Engineers Fail and SucceedHow Long Does It Take to Prepare for a System Design Interview?System Design Mock InterviewsLet AI Evaluate Your System Design Interview Preparation
3.
Preliminary System Design Concepts
Preliminary System Design Concepts
4 Lessons
4 Lessons
Grasp the fundamentals of abstractions in distributed systems, focusing on network abstraction, consistency, and failure models crucial for System Design.
4.
Non-Functional System Characteristics
Non-Functional System Characteristics
7 Lessons
7 Lessons
Review key non-functional characteristics like availability, reliability, scalability, and fault tolerance in System Design.
5.
Back-of-the-Envelope Calculations
Back-of-the-Envelope Calculations
2 Lessons
2 Lessons
Learn how to estimate resource needs like servers, storage, and bandwidth using back-of-the-envelope calculations for System Design.
7.
Domain Name System
Domain Name System
2 Lessons
2 Lessons
Discover how DNS works and its role in System Design, including detailed insights into its design and functionality.
8.
Load Balancers
Load Balancers
3 Lessons
3 Lessons
Take a closer look at load balancers, their placement, and algorithms, including local and global load balancers and different tiers of load balancers.
9.
Databases
Databases
5 Lessons
5 Lessons
Explore databases and their types, data replication, partitioning, and trade-offs essential for designing distributed systems.
10.
Key-Value Store
Key-Value Store
5 Lessons
5 Lessons
Learn how to design a scalable key-value store, focusing on replication, versioning, and fault tolerance.
11.
Content Delivery Network (CDN)
Content Delivery Network (CDN)
7 Lessons
7 Lessons
Discover CDN design, content caching strategies, consistency, and techniques for efficient content delivery.
12.
Sequencer
Sequencer
3 Lessons
3 Lessons
Learn how to design a sequencer for generating unique IDs, focusing on causality and consistency in distributed systems.
13.
Distributed Monitoring
Distributed Monitoring
3 Lessons
3 Lessons
Explore a distributed monitoring system’s basics, types, and metrics for effective monitoring.
14.
Monitor Server-Side Errors
Monitor Server-Side Errors
3 Lessons
3 Lessons
Learn how to design a monitoring system and visualize it for tracking server-side errors in real-time.
15.
Monitor Client-Side Errors
Monitor Client-Side Errors
2 Lessons
2 Lessons
Discover how to design a system to monitor client-side errors, ensuring robust and reliable applications.
16.
Distributed Cache
Distributed Cache
6 Lessons
6 Lessons
Unpack the design of a distributed cache, focusing on high-level and detailed designs and evaluating its performance.
17.
Distributed Messaging Queue
Distributed Messaging Queue
7 Lessons
7 Lessons
Examine the design of a distributed messaging queue, addressing requirements, design considerations, and performance evaluations.
18.
Pub-Sub
Pub-Sub
3 Lessons
3 Lessons
Learn the design of a pub-sub system, focusing on how to implement and optimize this communication pattern in distributed systems.
19.
Rate Limiter
Rate Limiter
5 Lessons
5 Lessons
Explore the design of a rate limiter, covering essential algorithms and considerations for managing traffic and ensuring system stability.
20.
Blob Store
Blob Store
6 Lessons
6 Lessons
Learn how to design a blob store, focusing on scalability, storage, and performance evaluation.
21.
Distributed Search
Distributed Search
6 Lessons
6 Lessons
Step through distributed search design in stages, with a special focus on indexing, scaling, and replication.
22.
Distributed Logging
Distributed Logging
3 Lessons
3 Lessons
Understand the importance and design of a distributed logging service, emphasizing capturing and analyzing logs across distributed systems.
23.
Distributed Task Scheduler
Distributed Task Scheduler
5 Lessons
5 Lessons
Examine the design of a task scheduler addressing issues like prioritizing, task idempotency, queuing, and resource capacity optimization.
24.
Sharded Counters
Sharded Counters
4 Lessons
4 Lessons
Get familiar with sharded counters and their importance, starting from high-level design and then pivoting to detailed System Design.
25.
Concluding the Building Blocks Discussion
Concluding the Building Blocks Discussion
4 Lessons
4 Lessons
Wrap up the discussion on building blocks, evaluate your understanding using AI, and learn the RESHADED approach to tackle unseen System Design problems.
26.
Design YouTube
Design YouTube
6 Lessons
6 Lessons
Learn YouTube System Design, starting with requirements, high-level and detailed design, evaluation of the design, and handling real-world complexities.
27.
Design Quora
Design Quora
5 Lessons
5 Lessons
Explore the System Design of Quora incrementally by starting with key requirements and challenges in building a scalable Q&A platform.
28.
Design Google Maps
Design Google Maps
6 Lessons
6 Lessons
Walk through the System Design of Google Maps, focusing on API design, scalability, finding optimal routes, and ETA computation.
29.
Design a Proximity Service/Yelp
Design a Proximity Service/Yelp
5 Lessons
5 Lessons
Take a closer look at the System Design of a proximity service like Yelp, addressing requirements like searching, scaling, and dynamic segments.
30.
Design Uber
Design Uber
7 Lessons
7 Lessons
Understand how to design Uber, address requirements for ride-sharing platforms, detailed design, and fraud detection.
31.
Design Twitter
Design Twitter
6 Lessons
6 Lessons
Learn Twitter System Design, covering aspects like user interaction, API design, caching, storage, and client-side load balancing.
33.
Design Instagram
Design Instagram
5 Lessons
5 Lessons
Explore Instagram’s System Design, covering API design, storage schema, and timeline generation using pull, push, and hybrid approaches.
36.
Design WhatsApp
Design WhatsApp
6 Lessons
6 Lessons
Take a look at WhatsApp System Design with an emphasis on its API design, high security, and low latency of client-server messages.
37.
Design Typeahead Suggestion
Design Typeahead Suggestion
7 Lessons
7 Lessons
Discover the typeahead suggestion System Design, covering aspects like efficient data structures and assemblers for updating suggestions.
38.
Design a Collaborative Document Editing Service/Google Docs
Design a Collaborative Document Editing Service/Google Docs
5 Lessons
5 Lessons
Understand the System Design of Google Docs, using different techniques to address storage, collaborative editing, and concurrency issues.
39.
Design a Deployment System
Design a Deployment System
2 Lessons
2 Lessons
Explore the essentials of automating deployment and understand the strategies to design a code deployment system.
40.
Design a Payment System
Design a Payment System
2 Lessons
2 Lessons
Explore the functionality and design of secure, efficient payment systems in fintech.
41.
Design a ChatGPT System
Design a ChatGPT System
2 Lessons
2 Lessons
Explore the design and architecture of a scalable ChatGPT-like conversational system.
42.
Design a Data Infrastructure System
Design a Data Infrastructure System
3 Lessons
3 Lessons
Learn how scalable data infrastructure for AI/ML systems are designd, ensuring efficiency and reliability.
43.
LLM-Powered Customer Support Bot System Design
LLM-Powered Customer Support Bot System Design
2 Lessons
2 Lessons
Explore the design and functionality of an LLM-powered customer support bot.
44.
AI-Powered Code Assistant System Design
AI-Powered Code Assistant System Design
2 Lessons
2 Lessons
Explore the design and functionality of AI-powered code assistants for developers.
45.
Lessons from System Failures
Lessons from System Failures
4 Lessons
4 Lessons
Learn how to avoid failures and outages by discussing case studies of real-world, large-scale distributed systems like Facebook, AWS, etc.
46.
Concluding Remarks
Concluding Remarks
2 Lessons
2 Lessons
Reflect on key takeaways, highlight unique aspects of each Design Problem, and get pointers on the next steps to master System Design.
47.
Free System Design Lessons
Free System Design Lessons
14 Lessons
14 Lessons
Master key System Design principles for scalable, reliable applications and effective interviews for free.
48.
System Design Case Studies
System Design Case Studies
5 Lessons
5 Lessons
Explore System Design case studies that reveal how top tech companies build scalable, resilient, and high-performance platforms.
Certificate of Completion
Showcase your accomplishment by sharing your certificate of completion.
Complete more lessons to unlock your certificate
Developed by MAANG Engineers
ABOUT THIS COURSE
For a decade, when developers talked about how to prepare for System Design Interviews, the answer was always Grokking System Design. This is that course — updated for the current tech landscape. As AI handles more of the routine work, engineers at every level are expected to operate with the architectural fluency that used to belong to Staff engineers. That's why System Design Interviews still determine starting level and compensation, and the bar keeps rising.
I built this course from my experience building global-scale distributed systems at Microsoft and Meta — and from interviewing hundreds of candidates at both companies. The failure pattern I kept seeing wasn't a lack of technical knowledge. Even strong coders would hit a wall, because System Design Interviews don't test what you can build; they test whether you can reason through an ambiguous problem, communicate ideas clearly, and defend trade-offs in real time (all skills that matter ore than never now in the AI era). RESHADED is the framework I developed to fix that: a repeatable 45-minute roadmap through any open-ended System Design problem.
The course covers the distributed systems fundamentals that appear in every interview – databases, caches, load balancers, CDNs, messaging queues, and more – then applies them across 13+ real-world case studies: YouTube, WhatsApp, Uber, Twitter, Google Maps, and modern systems like ChatGPT and AI/ML infrastructure. Then put your knowledge to the test with AI Mock Interviews designed to simulate the real interview experience.
Hundreds of thousands of candidates have already used this course to land SWE, TPM, and EM roles at top companies. If you're serious about acing your next System Design Interview, this is the best place to start.
ABOUT THE AUTHOR
Fahim ul Haq
Software Engineer, Distributed Storage at Meta and Microsoft, Educative (Co-founder & CEO)
Trusted by 3 million developers working at companies
A clear path through System Design
Y
Yichen Wang
Software Engineer @ Microsoft
The course I actually apply at work
Nishal Pattan
Software Engineer @ Microsoft
Built for engineers and managers
Bruno Sampaio Pinho da Silva
Ubisoft
Promoted to mid-level in a year
E
Edward Teixeira Dias Júnior
Volvo Group
Confidence to chase senior roles
Zoddah Wise
Buildria
AI questions that make it stick
M
Mike Rabatin
Learner
The most comprehensive by far
K
Kshitij Tiwari
Arachnomesh Technologies
Real trade-offs, real depth
A
Abhishek R
Learner
Built for 10x Developers
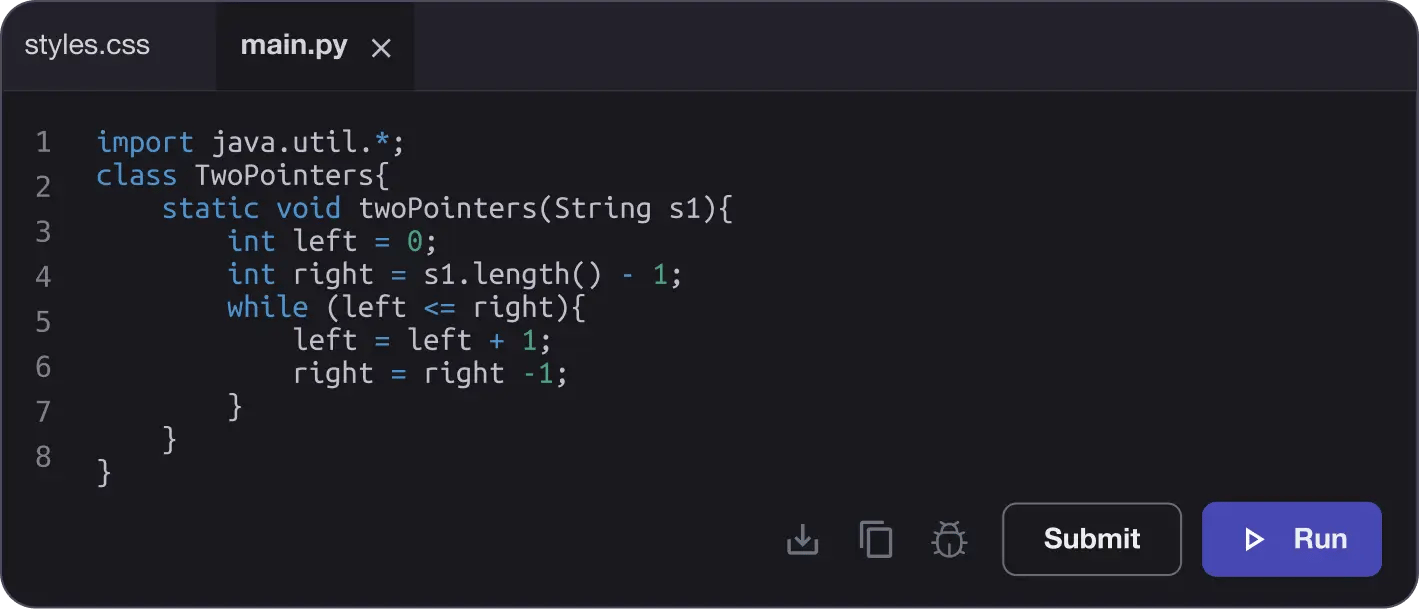
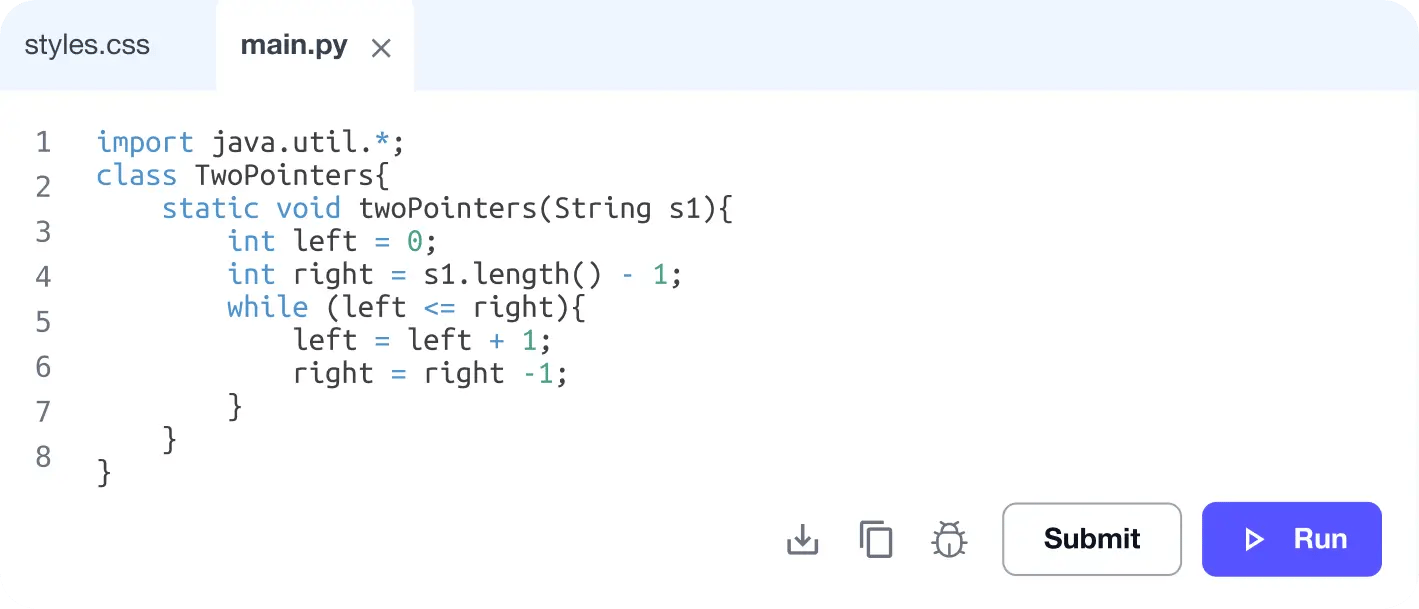
No Passive Learning
Learn by building with project-based lessons and in-browser code editor
Personalized Roadmaps
The platform adapts to your strengths & skills gaps as you go


Future-proof Your Career
Get hands-on with in-demand skills
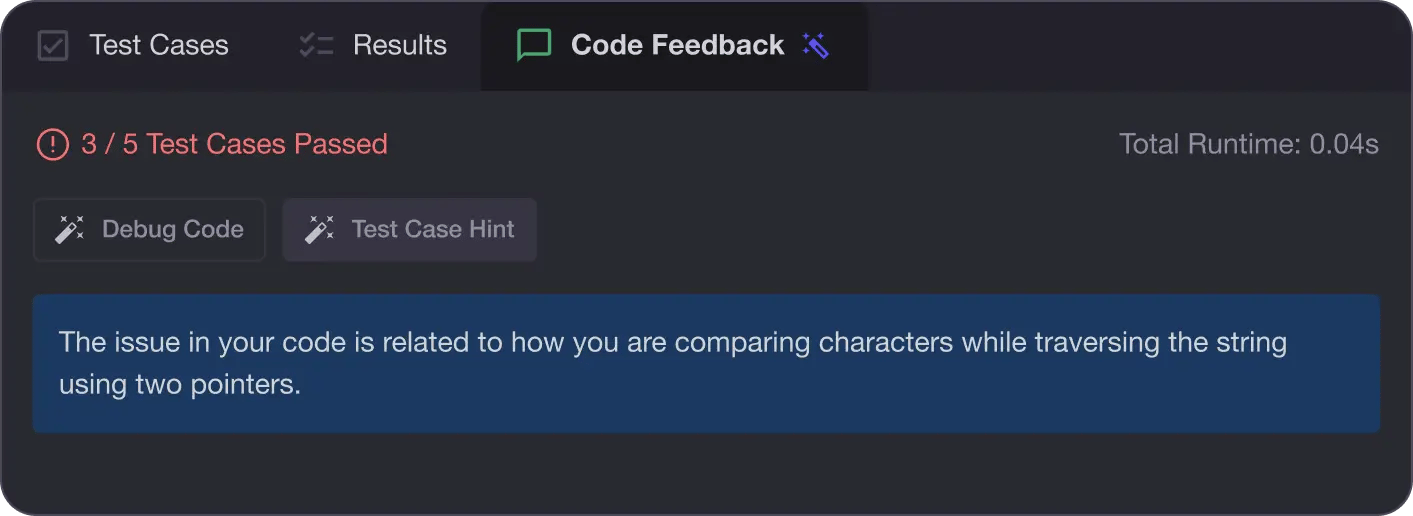
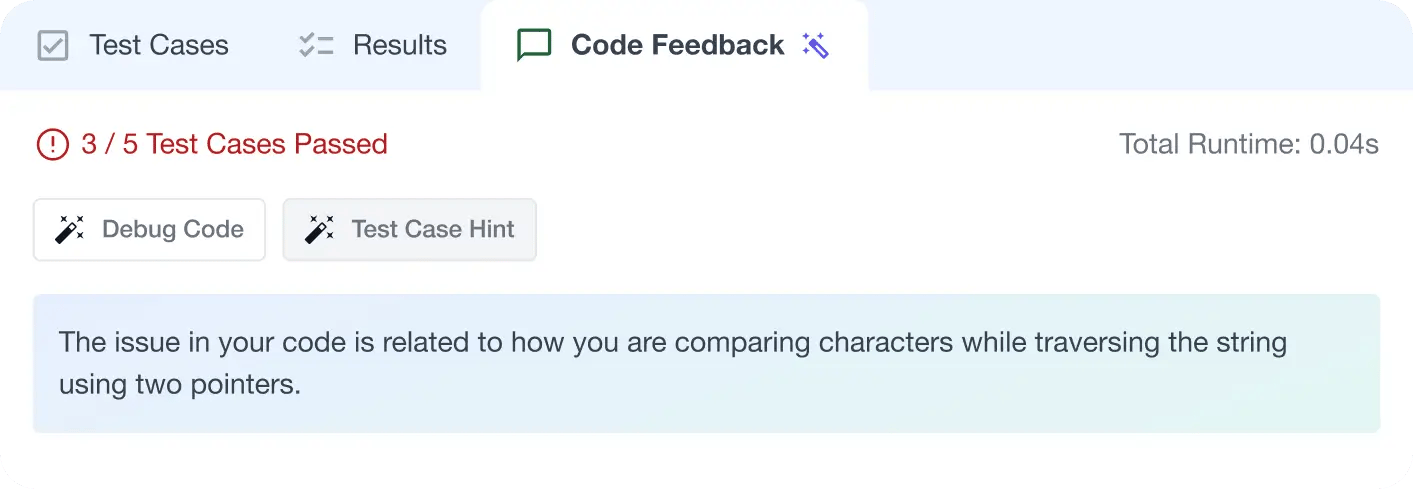
AI Code Mentor
Write better code with AI feedback, smart debugging, and "Ask AI"
MAANG+ Interview Prep
AI Mock Interviews simulate every technical loop at top companies

Free Resources
cheatsheet
cheatsheet
cheatsheet
blog
guide
Frequently Asked Questions
Is it worth learning System Design in 2026?
Who should take Grokking the System Design Interview in 2026?
What is System Design?
What makes Grokking System Design different from other system design courses?
Is there coding involved in the System Design Interview?
What are the expectations in a System Design Interview?
How do I prepare for a System Design Interview?
What does the System Design Interview for engineering managers involve?
How hard is it to ace a System Design Interview?
How do I study for a System Design Interview?
How do I practice System Design Interviews?
How long does it take to prepare for a System Design Interview?
How long is a System Design Interview?
What is Grokking System Design Interview?
What is the purpose of Grokking System Design Interview?
Is the Grokking System Design Interview hard?
