AI-powered learning
Save this course
Accelerated Linux Core Dump Analysis
Gain insights into debugging Linux process and kernel failures using GDB and crash utility. Delve into memory dump analysis, identifying issues like memory leaks, CPU spikes, and deadlocks.
4.6
53 Lessons
15h
Join 2.9 million developers at
Join 2.9 million developers at
LEARNING OBJECTIVES
- A working knowledge of how to collect core dumps
- A hands-on knowledge on how to diagnose crashes/hangs via core dump analysis
- The ability to apply pattern-oriented analysis on 64-bit core dumps on x86 architecture
- A familiarity with debugging to diagnose common faults
- The ability to use GDB debugger to analyze Linux process core dump
- An understanding of using the crash utility to analyze Linux kernel core dumps
Learning Roadmap
2.
Fundamentals of Core Dump Analysis
Fundamentals of Core Dump Analysis
Grasp the fundamentals of core dump analysis in Linux, covering memory, threads, exceptions, and diagnostics.
3.
Using GDB With Multi-Threaded Applications
Using GDB With Multi-Threaded Applications
5 Lessons
5 Lessons
Work your way through debugging multi-threaded applications using GDB commands and core dump analysis.
4.
Null Pointer Patterns and External Debugging Information
Null Pointer Patterns and External Debugging Information
5 Lessons
5 Lessons
Apply your skills to detect and debug NULL pointer exceptions using core dump analysis.
5.
Spiking Threads
Spiking Threads
3 Lessons
3 Lessons
Take a closer look at spiking threads, their identification, and in-depth analysis patterns.
6.
Heap Corruption
Heap Corruption
3 Lessons
3 Lessons
Follow the process of identifying and debugging heap corruption to manage dynamic memory issues effectively.
7.
Stack Corruption and Overflow
Stack Corruption and Overflow
4 Lessons
4 Lessons
Master the steps to identify and resolve stack corruption and overflow issues using core dump analysis.
8.
Active Threads
Active Threads
3 Lessons
3 Lessons
Learn how to use core dump analysis to identify and diagnose active thread issues.
9.
Runtime Exceptions and Execution Residues
Runtime Exceptions and Execution Residues
3 Lessons
3 Lessons
Unpack the core of detecting runtime exceptions and analyzing execution residues in Linux dumps.
10.
Heap Errors
Heap Errors
4 Lessons
4 Lessons
Lay out a solution for diagnosing and resolving heap leaks, contention, and critical region errors.
11.
Deadlocks
Deadlocks
2 Lessons
2 Lessons
Find out about deadlock identification through core dumps, thread stack examination, and mutex analysis.
12.
Post-processing
Post-processing
2 Lessons
2 Lessons
Solve problems in analyzing core dumps through memory snapshots, functions, and variable insights.
13.
Kernel Dump Analysis with Crash
Kernel Dump Analysis with Crash
7 Lessons
7 Lessons
Investigate kernel core dumps and utilize the crash tool for extensive debugging.
14.
Wrapping Up
Wrapping Up
2 Lessons
2 Lessons
Build on your core dump analysis skills with FAQs and comprehensive troubleshooting knowledge.
15.
Appendix
Appendix
2 Lessons
2 Lessons
Try out installing essential debugging tools and utilizing advanced analysis patterns.
Certificate of Completion
Showcase your accomplishment by sharing your certificate of completion.
Complete more lessons to unlock your certificate
Developed by MAANG Engineers
ABOUT THIS COURSE
It’s essential to examine core dumps to diagnose any non-trivial hangs or crashes due to a user process or the kernel faults. Most people have no training in dealing with core dumps, so the causes of most crashes remain undiagnosed.
This course starts with debugging core dumps. You will learn how to debug the Linux process and kernel failures (using the GDB debugger and the crash utility), browse core memory dumps, identify corruption, memory leaks, CPU spikes, halted threads, deadlocks and wait chains, among other things.
Instead of taking a theoretical route, you will focus on hands-on lessons on a variety of memory analysis patterns found in 64-bit core memory dumps from the x64 architecture. You will follow the novel pattern-oriented diagnostic analysis approach that considerably helps with the analysis. Moreover, the course will provide you with problematic applications and the associated core dumps, along with brief descriptions of relevant patterns and some frequently asked questions.
ABOUT THE AUTHOR
Dmitry Vostokov
Diagnostician. The Author of Diagnomicon.
Trusted by 2.9 million developers working at companies
A
Anthony Walker
@_webarchitect_
E
Evan Dunbar
ML Engineer
S
Software Developer
Carlos Matias La Borde
S
Souvik Kundu
Front-end Developer
V
Vinay Krishnaiah
Software Developer
Built for 10x Developers
No Passive Learning
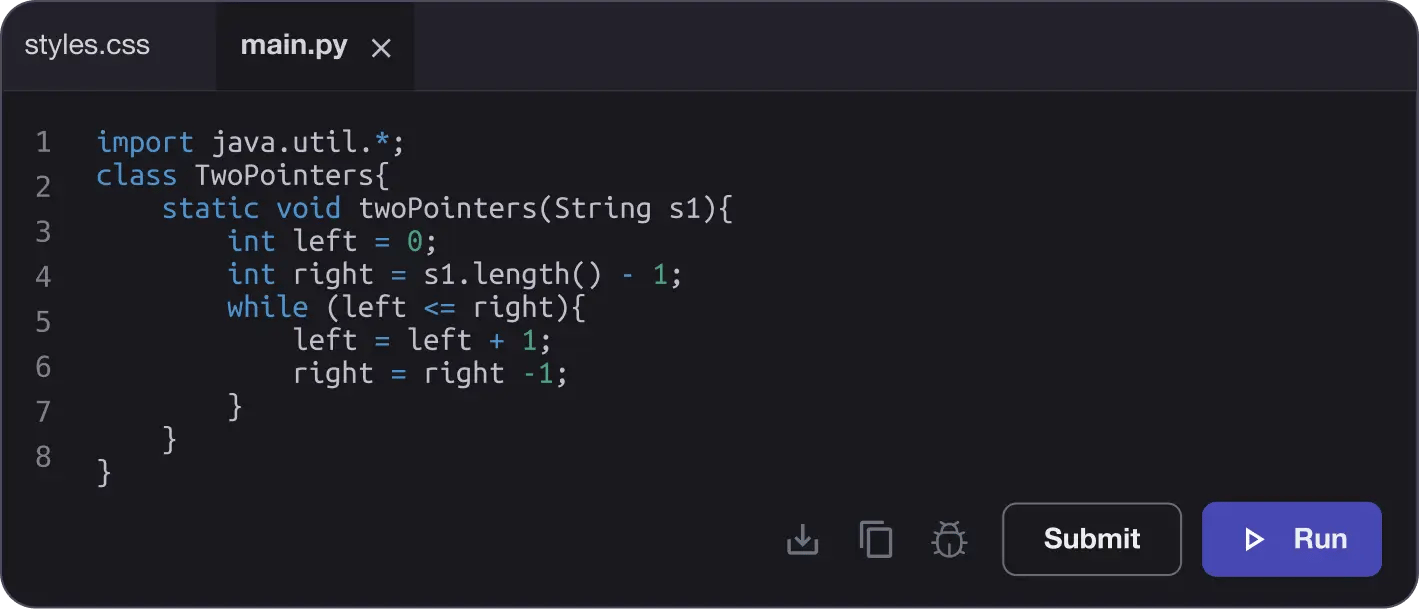
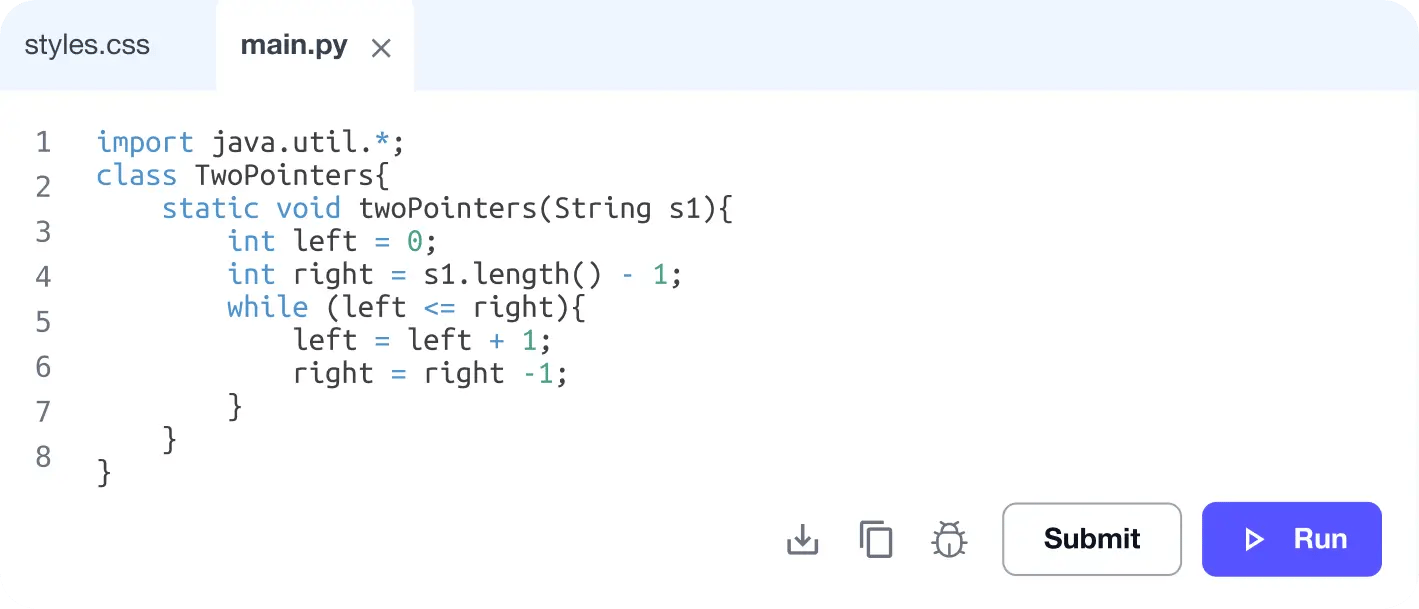
Learn by building with project-based lessons and in-browser code editor
Personalized Roadmaps
The platform adapts to your strengths & skills gaps as you go


Future-proof Your Career
Get hands-on with in-demand skills
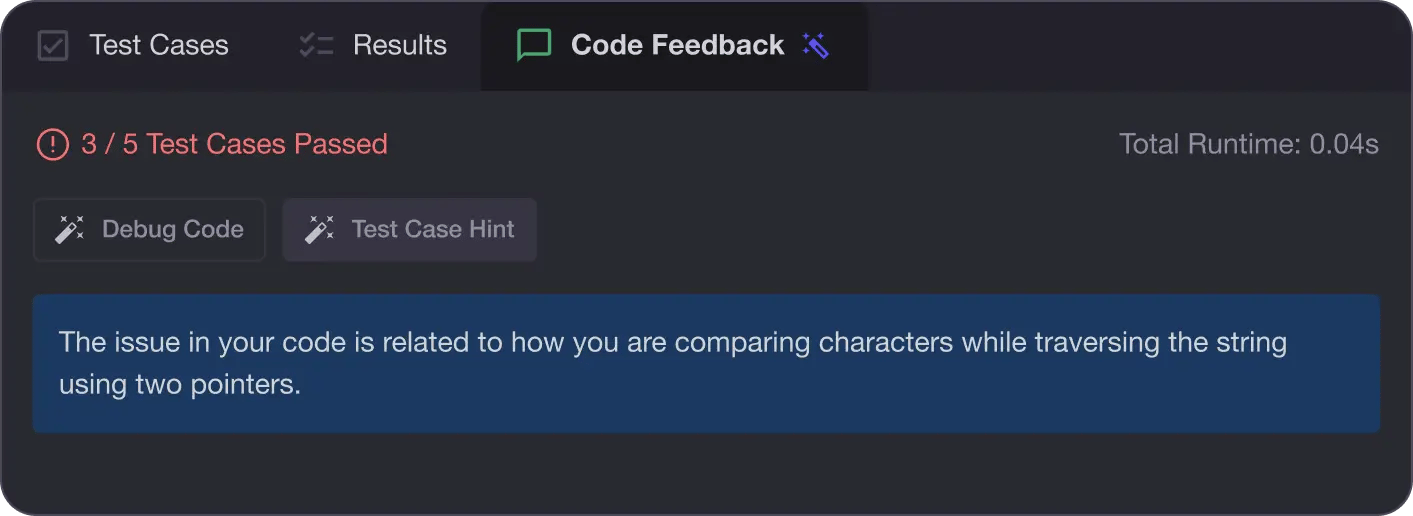
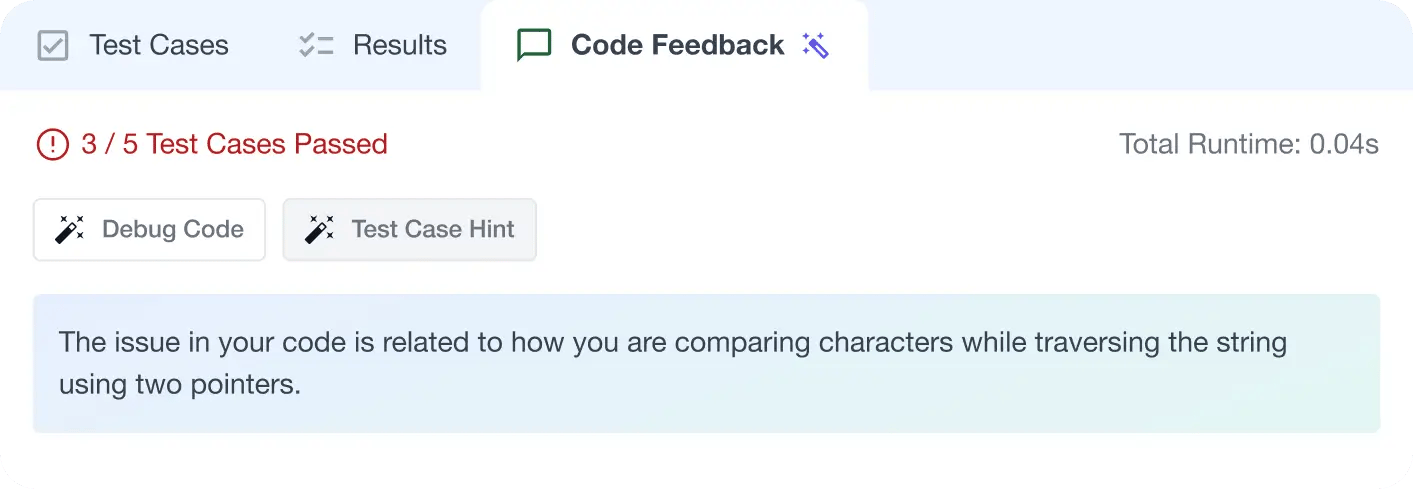
AI Code Mentor
Write better code with AI feedback, smart debugging, and "Ask AI"
MAANG+ Interview Prep
AI Mock Interviews simulate every technical loop at top companies

Free Resources
