AI-powered learning
Save this course
Introduction to Data Analysis and Visualization with R
Gain insights into data manipulation, analysis, and visualization with R. Learn statistical concepts, create insightful visualizations, and empower decision-making to excel in data-centric roles.
4.8
70 Lessons
2 Projects
20h
Join 2.9 million developers at
Join 2.9 million developers at
LEARNING OBJECTIVES
- Proficiency in data manipulation and analysis using R language
- Profound knowledge of basic data structures in R language and file management
- Understanding of statistical concepts and their interpretation
- Expertise in creating meaningful data visualizations using R
- Hands-on experience with a project based on a real dataset
- Proficiency in implementing data-driven decision-making skills
Learning Roadmap
1.
Getting Started
Getting Started
Get familiar with R programming, essential packages, and practice with ready-to-use datasets.
2.
File Management
File Management
Grasp the fundamentals of reading, loading, and saving data efficiently in R.
3.
Data Structures
Data Structures
10 Lessons
10 Lessons
Master the steps to understand R data types, coercion, structures, and string manipulation.
4.
Data Cleaning
Data Cleaning
11 Lessons
11 Lessons
Grasp the fundamentals of data cleaning in R, including managing, transforming, and exploring data frames.
5.
Statistical Analysis
Statistical Analysis
14 Lessons
14 Lessons
Deepen your knowledge of statistical methods, hypothesis testing, sampling, and data relationships using R.
6.
Data Transformation
Data Transformation
9 Lessons
9 Lessons
Tackle data transformation in R using aggregation, crosstabs, normalization, outlier handling, encoding, and patient data challenges.
7.
Data Visualization
Data Visualization
18 Lessons
18 Lessons
Build on understanding chart functions, ggplot2, and various visualization techniques in R.
Certificate of Completion
Showcase your accomplishment by sharing your certificate of completion.
Complete more lessons to unlock your certificate
Developed by MAANG Engineers
ABOUT THIS COURSE
This course delves into data manipulation, analysis, and visualization with R. It demonstrates the power of R as open-source statistical software, unlocking valuable insights for decision-making across diverse fields.
You'll begin by mastering the basics of R programming, fundamental data structures in R, and file management. You will learn fundamental statistical concepts such as hypothesis testing and regression analysis. You will also learn to leverage well-structured data for creating insightful visualizations using R's robust graphics libraries.
After completing this course, you'll confidently approach data-driven challenges. With proficiency in R, you can efficiently manipulate and analyze data, positioning yourself as a sought-after asset in data-centric roles. Your ability to interpret statistical results and create compelling data visualizations will empower improved decision-making, paving the way for new opportunities for career growth and success across various industries.
ABOUT THE AUTHOR
Yusuf Gulcan
Data Scientist, Sports Enthusiast
Trusted by 2.9 million developers working at companies
A
Anthony Walker
@_webarchitect_
E
Evan Dunbar
ML Engineer
S
Software Developer
Carlos Matias La Borde
S
Souvik Kundu
Front-end Developer
V
Vinay Krishnaiah
Software Developer
Built for 10x Developers
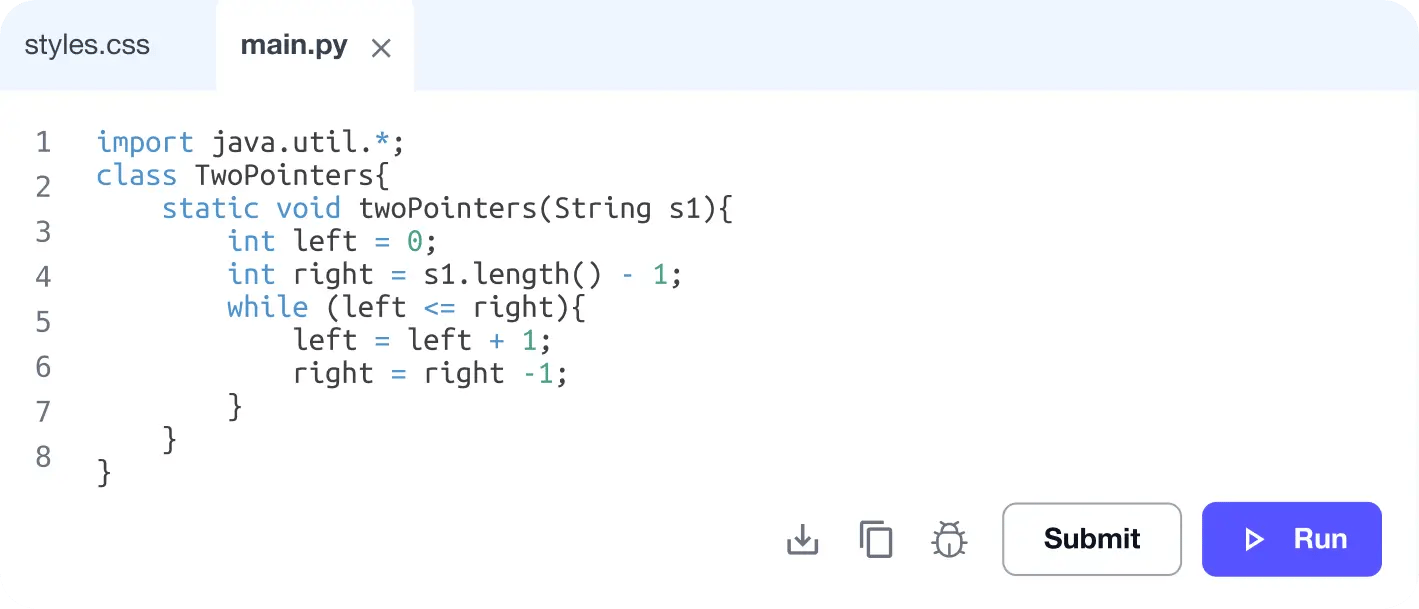
No Passive Learning
Learn by building with project-based lessons and in-browser code editor
Personalized Roadmaps
The platform adapts to your strengths & skills gaps as you go


Future-proof Your Career
Get hands-on with in-demand skills
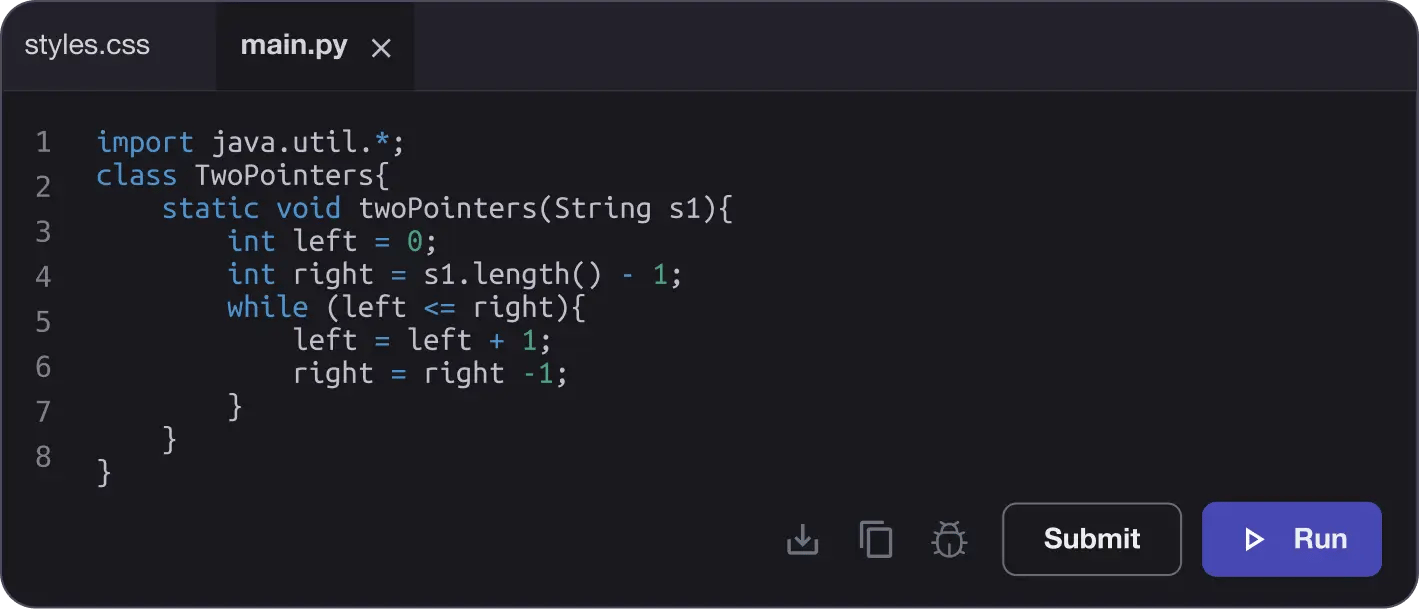
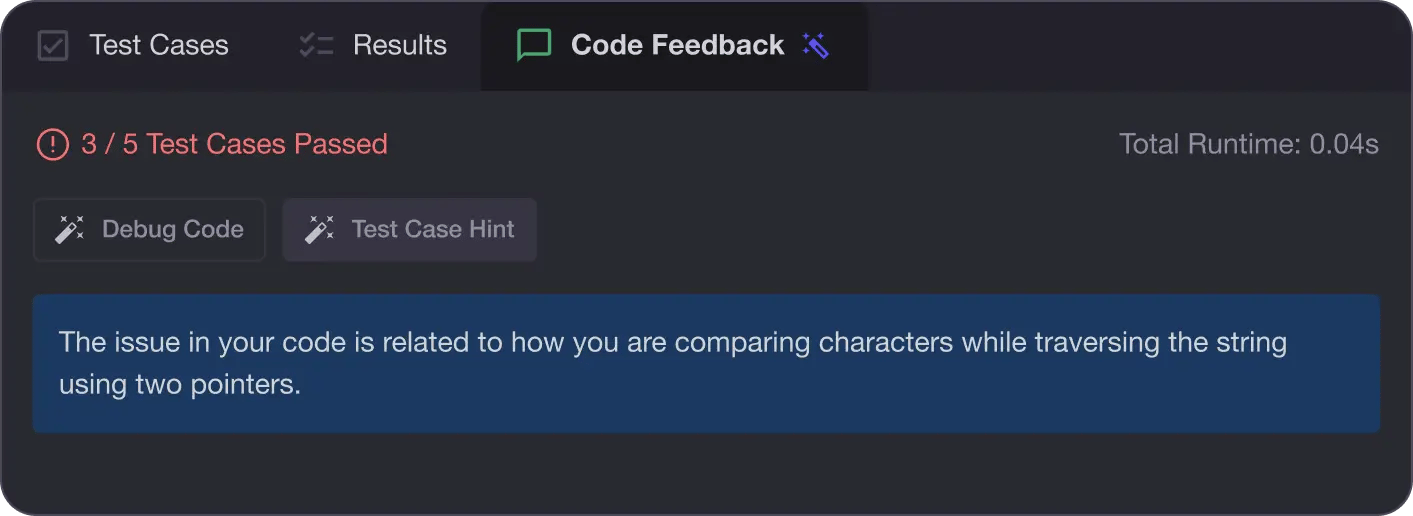
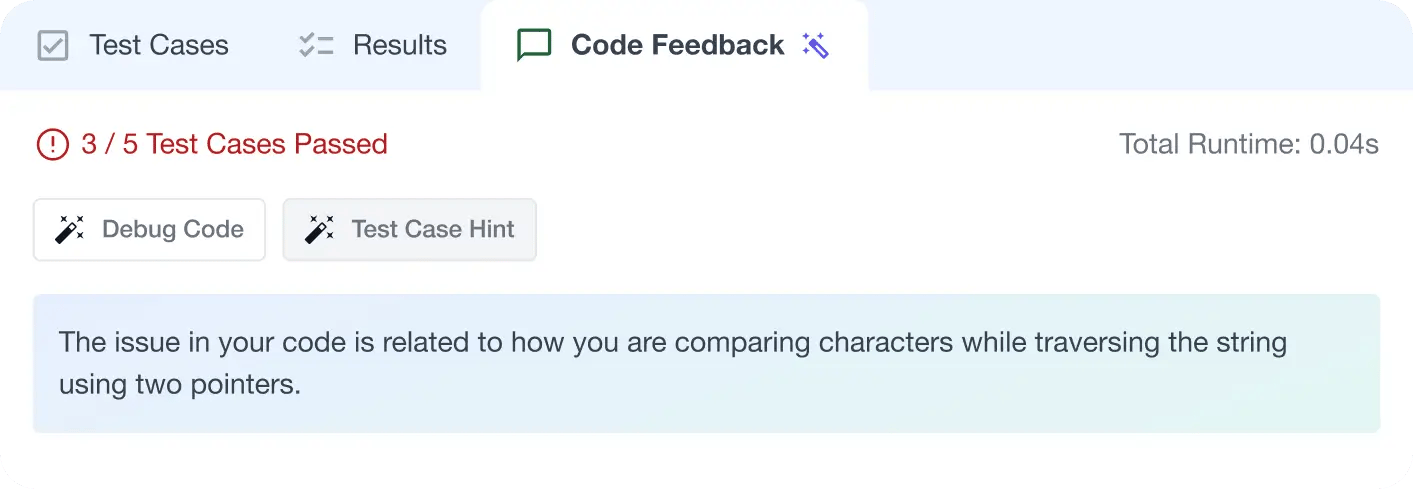
AI Code Mentor
Write better code with AI feedback, smart debugging, and "Ask AI"
MAANG+ Interview Prep
AI Mock Interviews simulate every technical loop at top companies

Free Resources
