AI-powered learning
Save this course
Foundations of Linux ARM64: Debug, Disassemble, and Reverse
Gain insights into debugging C/C++ programs on Linux ARM64, delve into program disassembly, probe memory/register changes using GDB, and discover techniques for core dump analysis and assembly-level debugging.
4.5
44 Lessons
12h
Join 2.9 million developers at
Join 2.9 million developers at
LEARNING OBJECTIVES
- Familiarity with disassembly in the GDB environment of simple C/C++ programs
- An understanding of how to debug programs with a cross-sectional view to the contents of registers, stack, and memory
- Ability to use GDB as a dump analysis tool
- Hands-on experience to reconstruct simple C/C++ programs from the disassembly output
- A deeper understanding of the basic assembly language programming skills
Learning Roadmap
2.
Memory, Registers, and Simple Arithmetic
Memory, Registers, and Simple Arithmetic
Unpack the core of memory and registers, arithmetic operations, and their implementation in ARM64.
3.
Code Optimization
Code Optimization
3 Lessons
3 Lessons
Go hands-on with GDB disassembly for both non-optimized and optimized C/C++ code.
4.
Number Representations
Number Representations
2 Lessons
2 Lessons
Grasp the fundamentals of number systems, including decimal, binary, ternary, and hexadecimal.
5.
Pointers
Pointers
6 Lessons
6 Lessons
Solve problems in Linux ARM64 debugging with advanced pointer operations and arithmetic.
6.
Bytes, Half Words, Words, and Double Words
Bytes, Half Words, Words, and Double Words
2 Lessons
2 Lessons
Investigate ARM64 memory management, organization, and the relationship between bytes, words, and memory addresses.
7.
Pointers to Memory
Pointers to Memory
3 Lessons
3 Lessons
Practice using pointers for memory management, addressing types, and debugging techniques in Linux ARM64.
8.
Logical Instructions and PC
Logical Instructions and PC
4 Lessons
4 Lessons
Get familiar with logical operations, zeroing methods, and the instruction pointer in ARM64.
9.
Reconstructing a Program with Pointers
Reconstructing a Program with Pointers
3 Lessons
3 Lessons
Unpack the core of program reconstruction using disassembly output and optimization techniques.
10.
Memory and Stacks
Memory and Stacks
3 Lessons
3 Lessons
Break apart stack operations, memory roles, and GDB exploration in ARM64 Linux.
11.
Frame Pointer and Local Variables
Frame Pointer and Local Variables
4 Lessons
4 Lessons
Enhance your skills in stack management, function prolog/epilog, and local variable debugging on ARM64.
12.
Function Parameters
Function Parameters
2 Lessons
2 Lessons
Take a closer look at ARM64 function parameters, stack usage, and debugging with GDB.
13.
More Instructions
More Instructions
2 Lessons
2 Lessons
Simplify complex topics like PSTATE flags, conditional jumps, TST and CMP instructions.
14.
Function Pointer Parameters
Function Pointer Parameters
2 Lessons
2 Lessons
Practice using GDB to explore function parameter implementation and arithmetic examples.
15.
Conclusion
Conclusion
2 Lessons
2 Lessons
Get familiar with ARM64 function prologs, epilogs, parameter passing, and practical disassembly.
Certificate of Completion
Showcase your accomplishment by sharing your certificate of completion.
Complete more lessons to unlock your certificate
Developed by MAANG Engineers
ABOUT THIS COURSE
The GNU Debugger (GDB) is used for debugging C/C++ programs in LINUX/UNIX environments. It is a good tool to investigate what is happening inside a program and how the contents inside the memory are changed with the execution of the program.
The main focus of the course is the disassembly of the program. You’ll use the Linux ARM64 which is a popular RISC architecture. You’ll use simple operations in C/C++ such as assignment, increment, addition, multiplication. With the help of the GDB, you will probe into the contents of the registers and memory. You'll learn how they are changed while executing basic operations. With the help of the disassembly output, you’ll learn how a simple C/C++ program can be reconstructed. The disassembly output is important for debugging and core dump analysis.
By the end of this course, you should be able to debug the programs and memory contents at assembly level when a program executes or probe into the problem when a program crashes.
ABOUT THE AUTHOR
Dmitry Vostokov
Diagnostician. The Author of Diagnomicon.
Trusted by 2.9 million developers working at companies
A
Anthony Walker
@_webarchitect_
E
Evan Dunbar
ML Engineer
S
Software Developer
Carlos Matias La Borde
S
Souvik Kundu
Front-end Developer
V
Vinay Krishnaiah
Software Developer
Built for 10x Developers
No Passive Learning
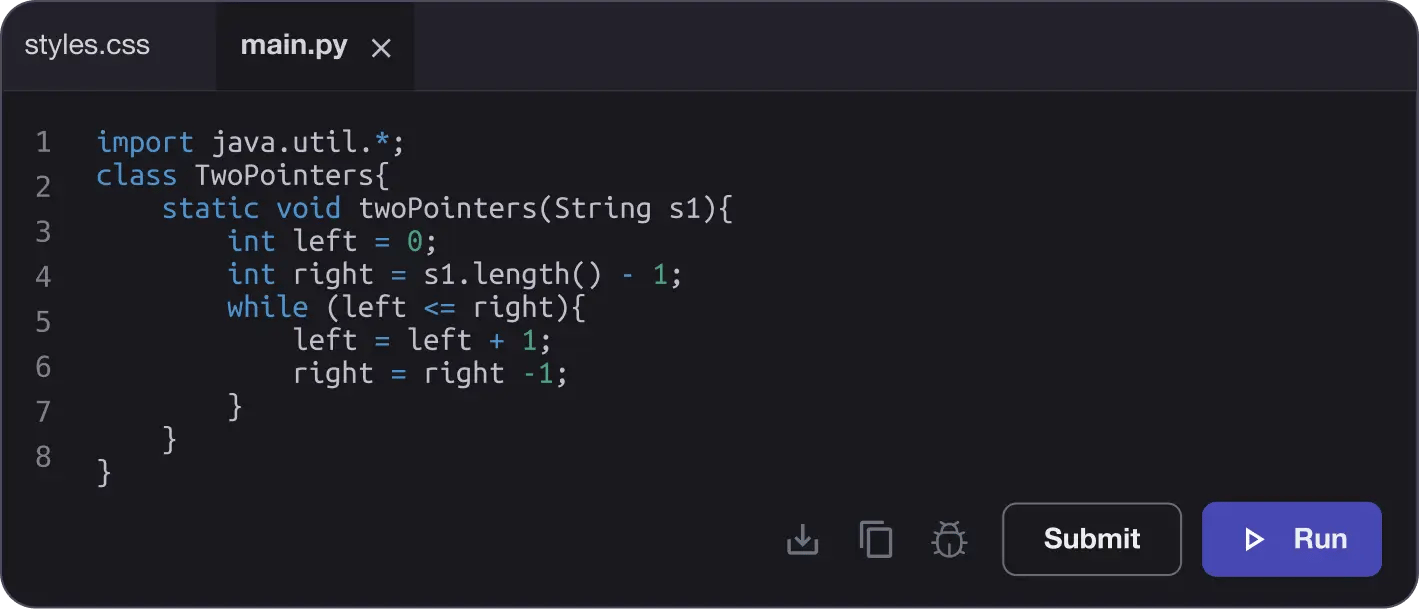
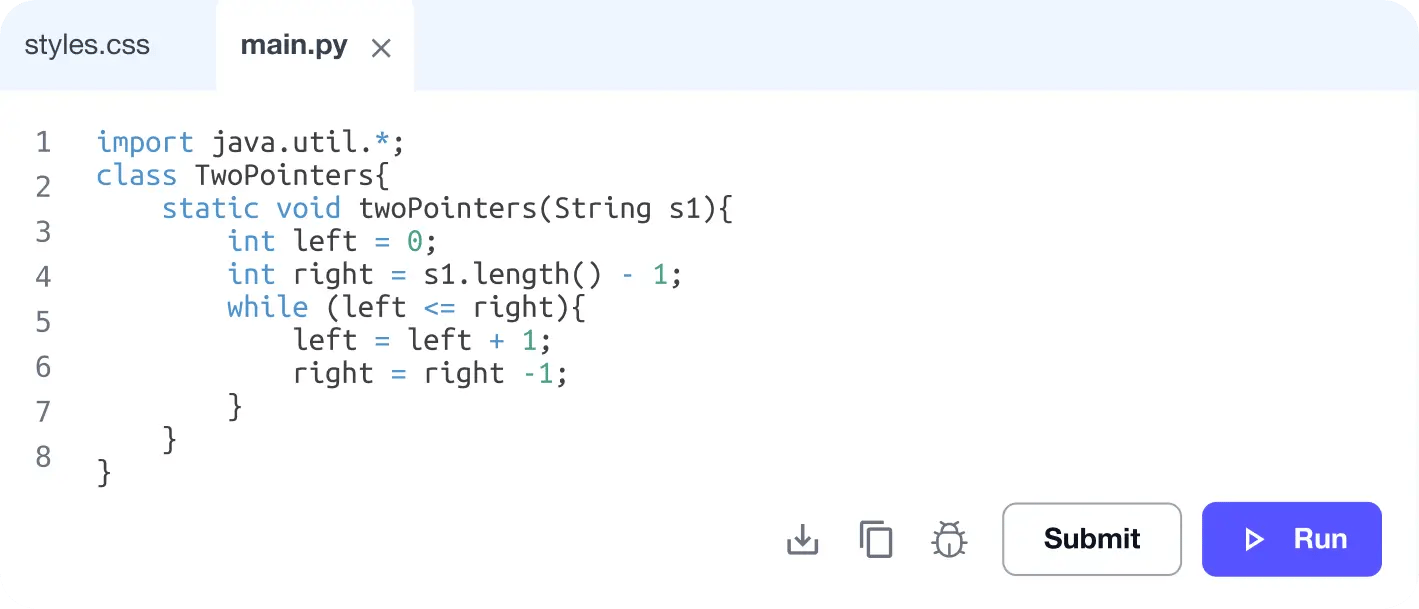
Learn by building with project-based lessons and in-browser code editor
Personalized Roadmaps
The platform adapts to your strengths & skills gaps as you go


Future-proof Your Career
Get hands-on with in-demand skills
AI Code Mentor
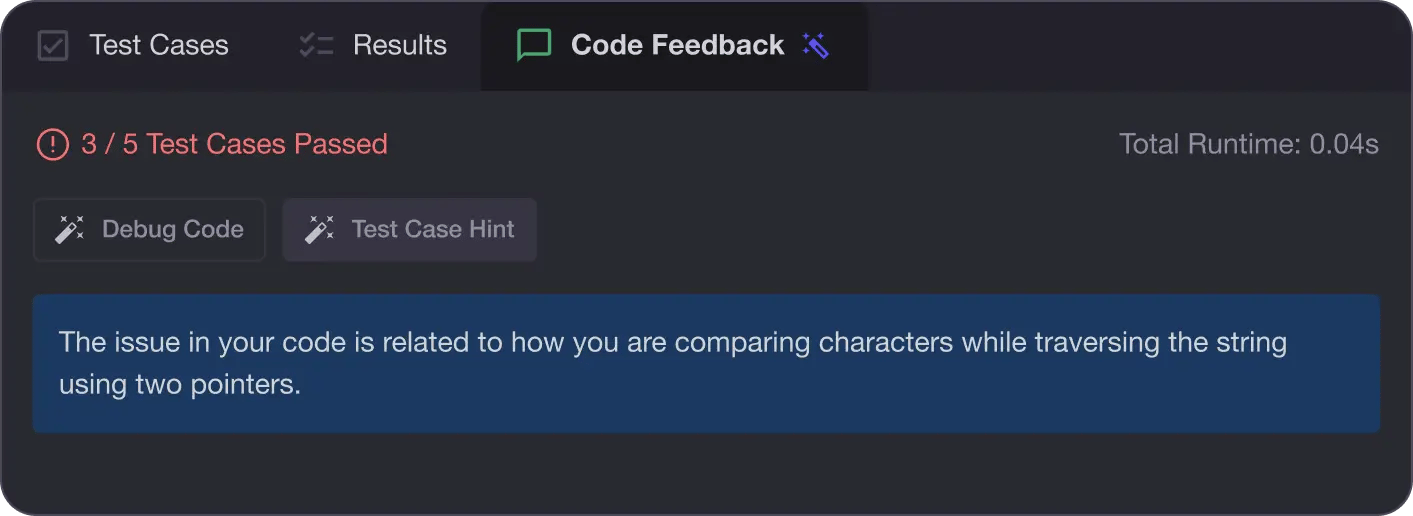
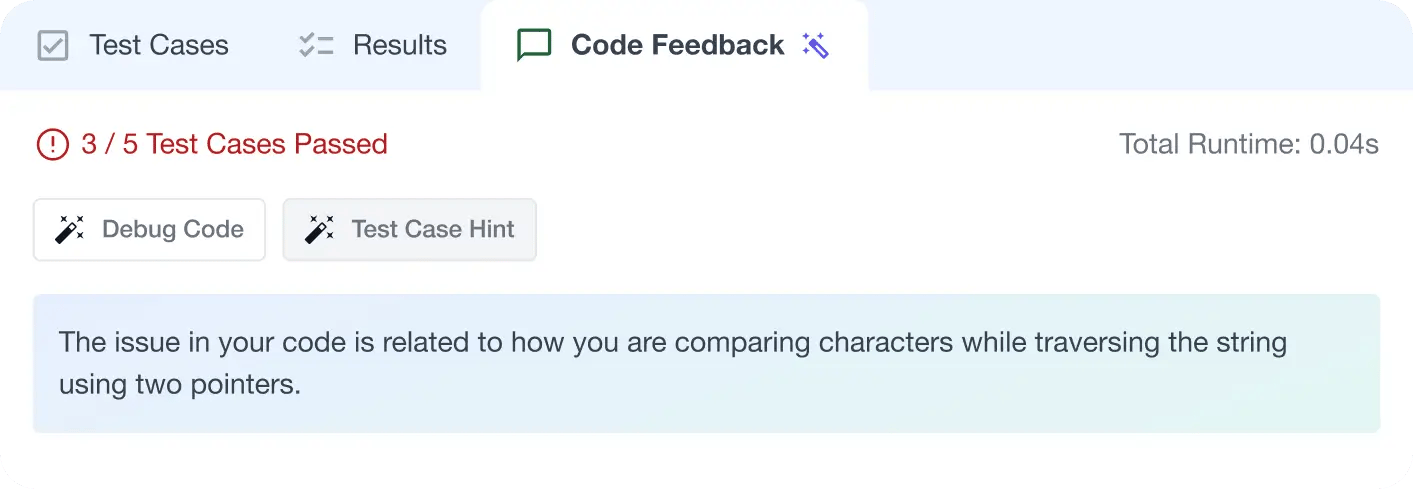
Write better code with AI feedback, smart debugging, and "Ask AI"
MAANG+ Interview Prep
AI Mock Interviews simulate every technical loop at top companies

Free Resources
